-
Examples -
VR-Gallery
PlotAR let's you quickly iteratively view and explore 3D plots of your data both in AR on your smartphone as well as in VR in your headset to get a real immersive impression so you can use the full power of the 3rd dimension. It can be as easy as:
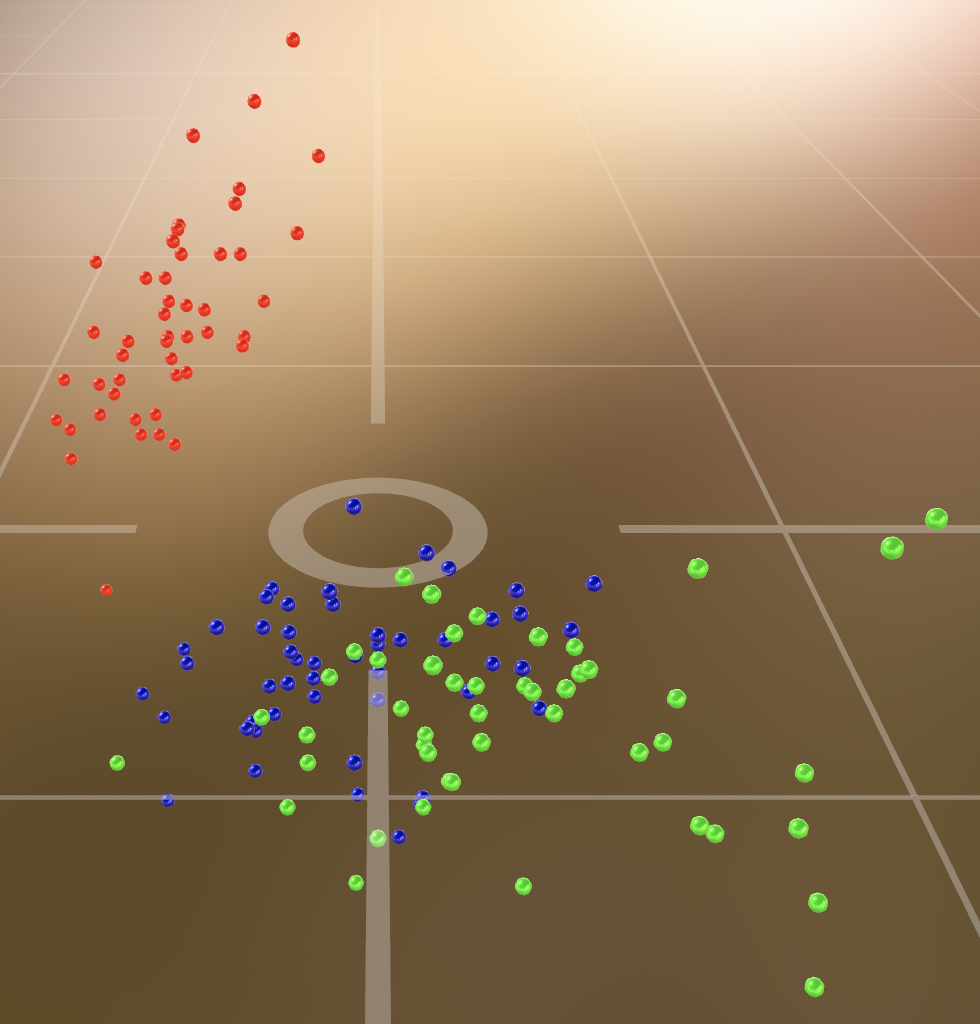
# scatter plot of iris data
plotar.plotar(iris.data, iris.target)
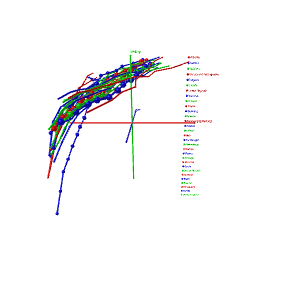
# lines plot
plotar.linear(gapminder, xyz=['gdpPercap','year','lifeExp'],
col='country', size='pop')
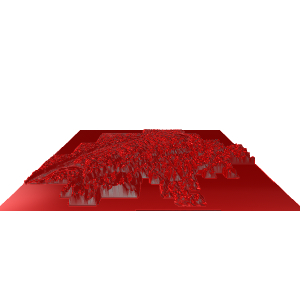
# surface of switzerland
plotar.surfacevr(switzerland, surfacecolor=sat_img, auto_scale=False)
# animation of development of countries
plotar.animate(gapminder, xyz=['income','children_per_woman','life_expectancy'],
group='country', col='sub_region', size='population',
animation_frame='year')
# animation of development of countries with country name directly in plot
plotar.animate(gapminder, xyz=['income','children_per_woman','life_expectancy'],
group='country', col='sub_region', size='population',
animation_frame='year', label='country')
| Example | Screenshot | iOS (usdz) Android (gltf) |
|---|---|---|
| iris The famous data set |
 |
|
| gapminder Only European countries |
 |
|
| PLZ Can you guess what it is? |
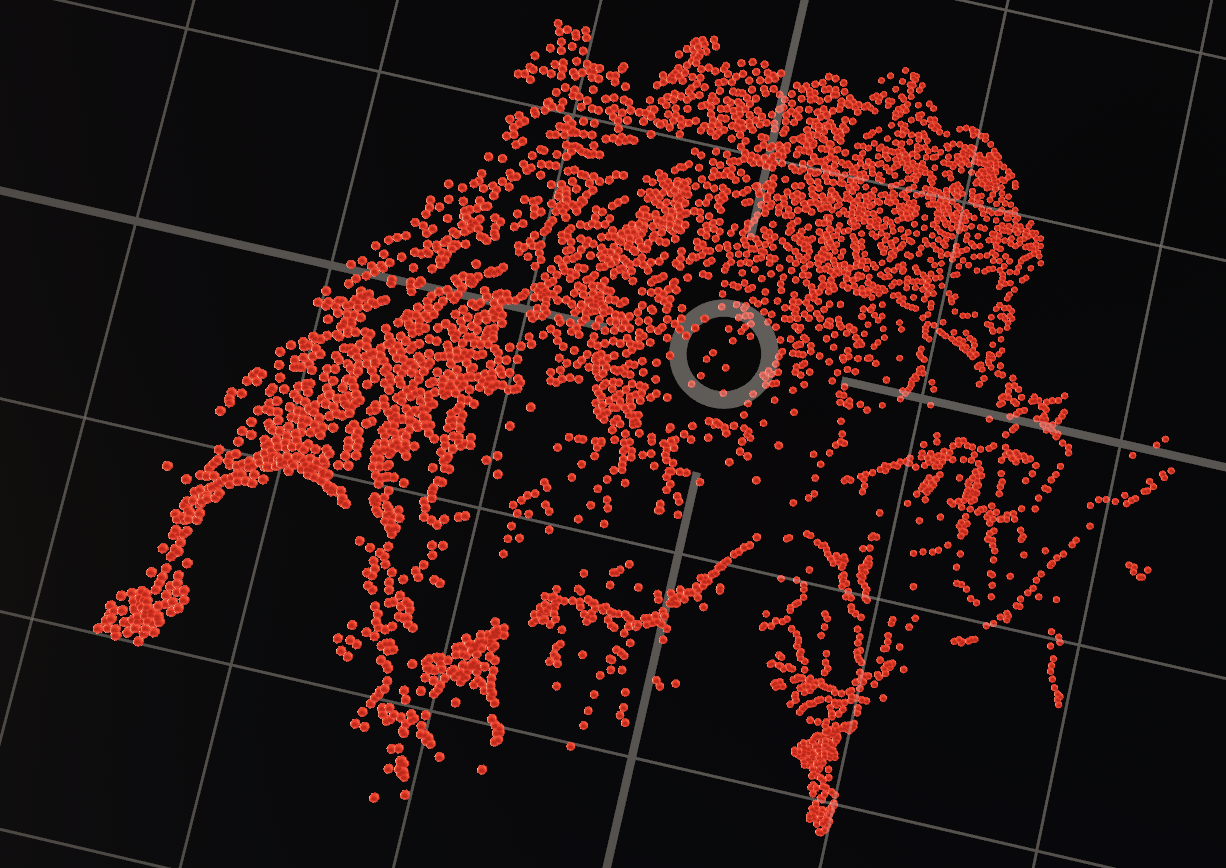 |
|
| planets Planets |
 |
|
| CH Surface of Switzerland |
 |
A nicer overview can be found here in examples/.
Check <demo.ipynb> to see how these samples were made - best is to go through that Notebook on
The R demo is in <demo.R> - again look at it on
This is a prototype to get your data into Augmented Reality (AR) or and navigate using the computer keyboard.
This package was presented at EuroPython 2019. Check out the recording video on https://www.youtube.com/watch?v=O1y96EG0bTw.
Are you bored by 3D-plots that only give you a simple rotatable 2d-projection? plotAR provides a simple way for data scientists to plot data, pick up a phone, get a real 3d impression - either by VR or by AR - and use the computer's keyboard to walk through the scatter plot (see live demo):

The technologies beneath this project are: a web server that handles the communication between the DataScience-session and the phone, WebSockets to quickly proxy the keyboard events, QR-codes facilitate the simple pairing of both, and an HTML-Page on the computer to grab the keyboard events. And the translation of these keyboard events into 3D terms is a nice exercise in three.js, OpenGL, and SceneKit for HTML, Android, and iOS resp.

Warning: Be careful whether data is transmitted unencrypted and everybody can connect! Please be carefule with private data!
Install the Python package:
pip install --upgrade plotARThis will also install PlotAR into your Jupyter Server - please restart Jupyter to be able to use it.
If you use Jupyter: For full support you will need to connect to that server from your mobile, this means you should start it with:
jupyter lab --ip="*"WARNING Jupyter is secured by default to have a non-guessable token to get some level of security, but still you probably do not use HTTPS, so anybody intercepting the traffic between you mobile device and your desktop can see all your data! This might be ok in your home network or in a company enterprise - be cautious! Traffic with mybinder.org actually is secured by HTTPS and the token.
Otherwise you can start a PlotAR-Server on e.g. the default port 2908:
plotar server -p 2908NOTE To experience your data in VR or more precise WebXR, the server needs to run on HTTPS or be localhost - the latter probably only makes sense on PC-VR devices. You can start the server with some (self-generated?) Key and Certificate using the --ssl-prefix my_plotar_keys.. Then you also need to set ignore_ssl_warnings=True in the python client and acknowledge in all the browsers the self-signed certificate (on newer Chrome Desktop Versions you need to type blindly THISISUNSAFE into the warning window to circumvent it). To generate such a self-signed key and certificate you can use openssl:
# generate a key
openssl genrsa -out my_plotar_keys.key 2048

# to specify the distinguised name info interactively
openssl req -new -x509 -key my_plotar_keys.key -out my_plotar_keys.crt -days 365

# else to specify the distinguised name info on the CLI

openssl req -new -x509 -key my_plotar_keys.key -out my_plotar_keys.crt -days 365 \
    -subj "/C=CH/ST=Zurich/O=My Name/CN=127.0.0.1"
You will be asked
Then open up http://localhost:2908/keyboard.html to see whether you can connect. This page also will show you a guess of a URL with your desktops IP-adress so you should be able to connect to it from your mobile - as long as both devices are in the same network!
Optionally the R-package can be installed using - but it will need access to a Python-based server:
devtools::install_github('thomann/plotAR',subdir='plotAR-R')For the server component:
- If you want to start the server from your R session easiest is to install the Pyhthon package using:
plotar::install_plotar_py()- Or you can connect to a running plotAR-Server
- start the python server, e.g. one on
- copy the URL using the copy button in the the keyboard view (e.g. something like
https://hub.gke2.mybinder.org/user/thomann-plotar-6sy8ghsu/plotar/keyboard.html?token=e9mbARgtR1-ieBp0vTnGuw) - in the R session issue
connectServer("https://...")
- start the python server, e.g. one on
Also check out the native mobile apps:
Working with the package is meant to be seamless - but it is a little hard to explain in text. Please check out the above video.
Here we will describe how to plot the data in RStudio or Jupyter, then view it on your device, and finally navigate through the scene.
In Python - or better even in Jupyter Lab - enter the following:
import plotar
from sklearn import datasets
iris = datasets.load_iris()
plotar.plotar(iris.data, iris.target)
This will look something like
 Just scan the QR-Code with your mobile device and then tap on the the AR-Icon.
In R load and plot the first three dimensions of iris with iris$Species as color:
library(plotAR)
startServer() # starts a python server via reticulate in background
plotAR(iris, col=Species)
Now you can open the advertised webpage - also on your mobile device using any QR-code reader:
http://<ip-address of your machine>:2908/keyboard.html
This will look something like (see live demo):

Naturally, you also can visit the server page on your computer: http://localhost:2908/plotAR.html.
Tap on the screen to bring it to full-screen!
Now in order to navigate through your scene you can use the keyboard. In order to capture key events click on the display keyboard:

They keyboard warns if it loses focus:
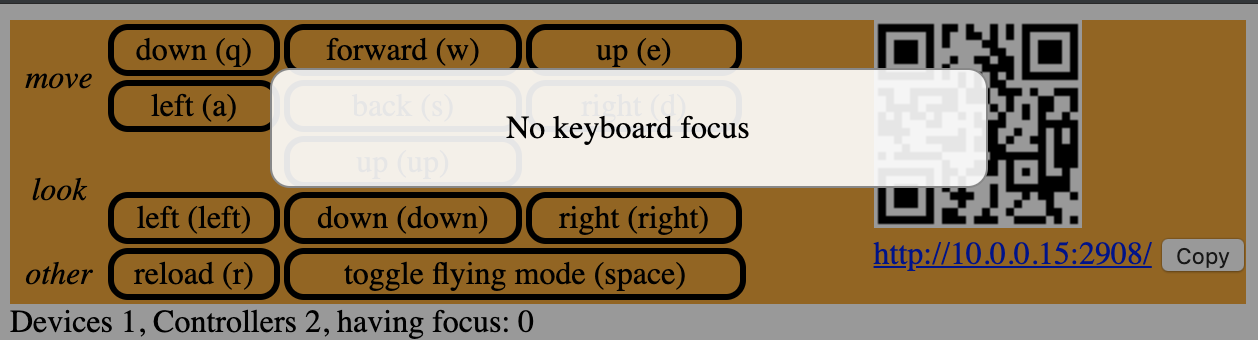
This window also will get the keyboard focus when it opens. You now can use your computer keyboard to navigate through the virtual space (like in Quake!):
| Key | Movement |
|---|---|
| w | forward |
| s | backward |
| a | left |
| d | right |
| q | up |
| e | down |
| up/down-arrow | rotate vertically |
| left/right-arrow | rotate horizontally |
| r | reload |
| space | toggle velocity |
Now if you plot something new it should be reloaded automatically in your viewer:
import numpy as np
boston = datasets.load_boston()
plotar.plotar(boston.data)
or
plotAR(trees)- The file
plotAR-matlab/plotAR.mcan be used in MATLAB if you have access to a running server in Python or R.
- Pixar for developing the USD-Tools and Nvidia for putting the
usd-corePyPI. - Google for the Model Viewer,
- For the WebXR-client:
three.jsand A-Frame. httpuvfor the websocket-server implementation in Rtornadofor the websocket-server implementation in Python- https://vr.google.com/cardboard/ for the cardboard!