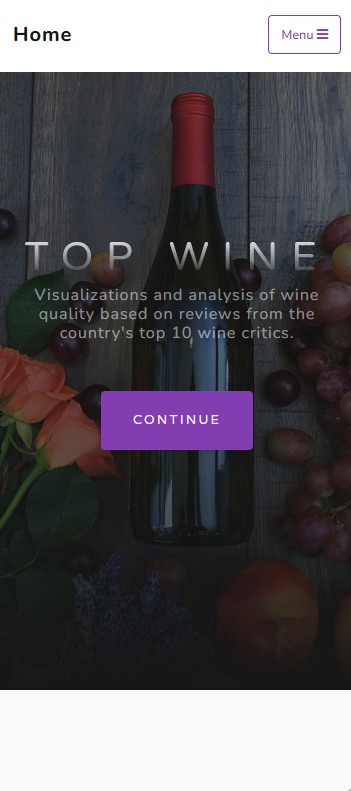
Visualizations and analysis of wine quality based on reviews from the country's top 10 wine critics. This was a group project at Washington University's Data Analytics Boot Camp (2019).

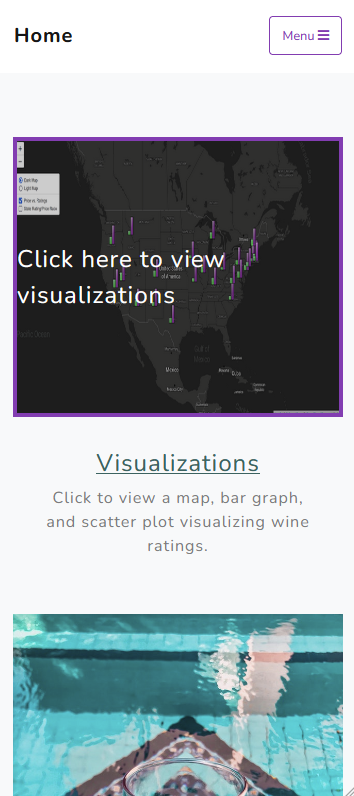
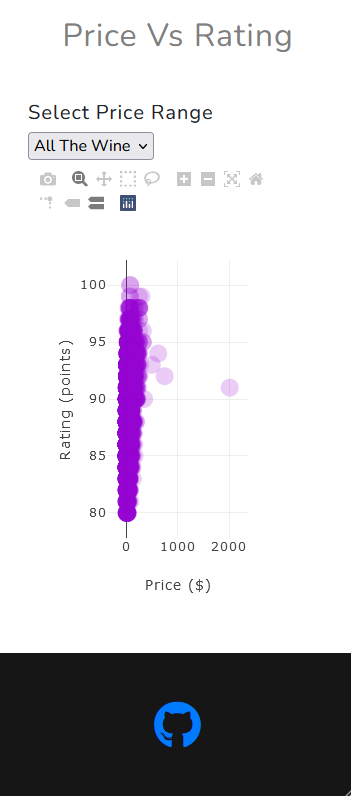
Our goal for this project is to create a set of visualizations to show how wine varieties, pricing, and ratings vary by location in the United States. We also want to show how ratings and price differ between wine varieties. The data set we are using comes from a web scraping project that sourced data points on individual wines from WineEnthusiast back in 2017. The data points collected include country of origin, description, points (rating), region, price, variety, etc.
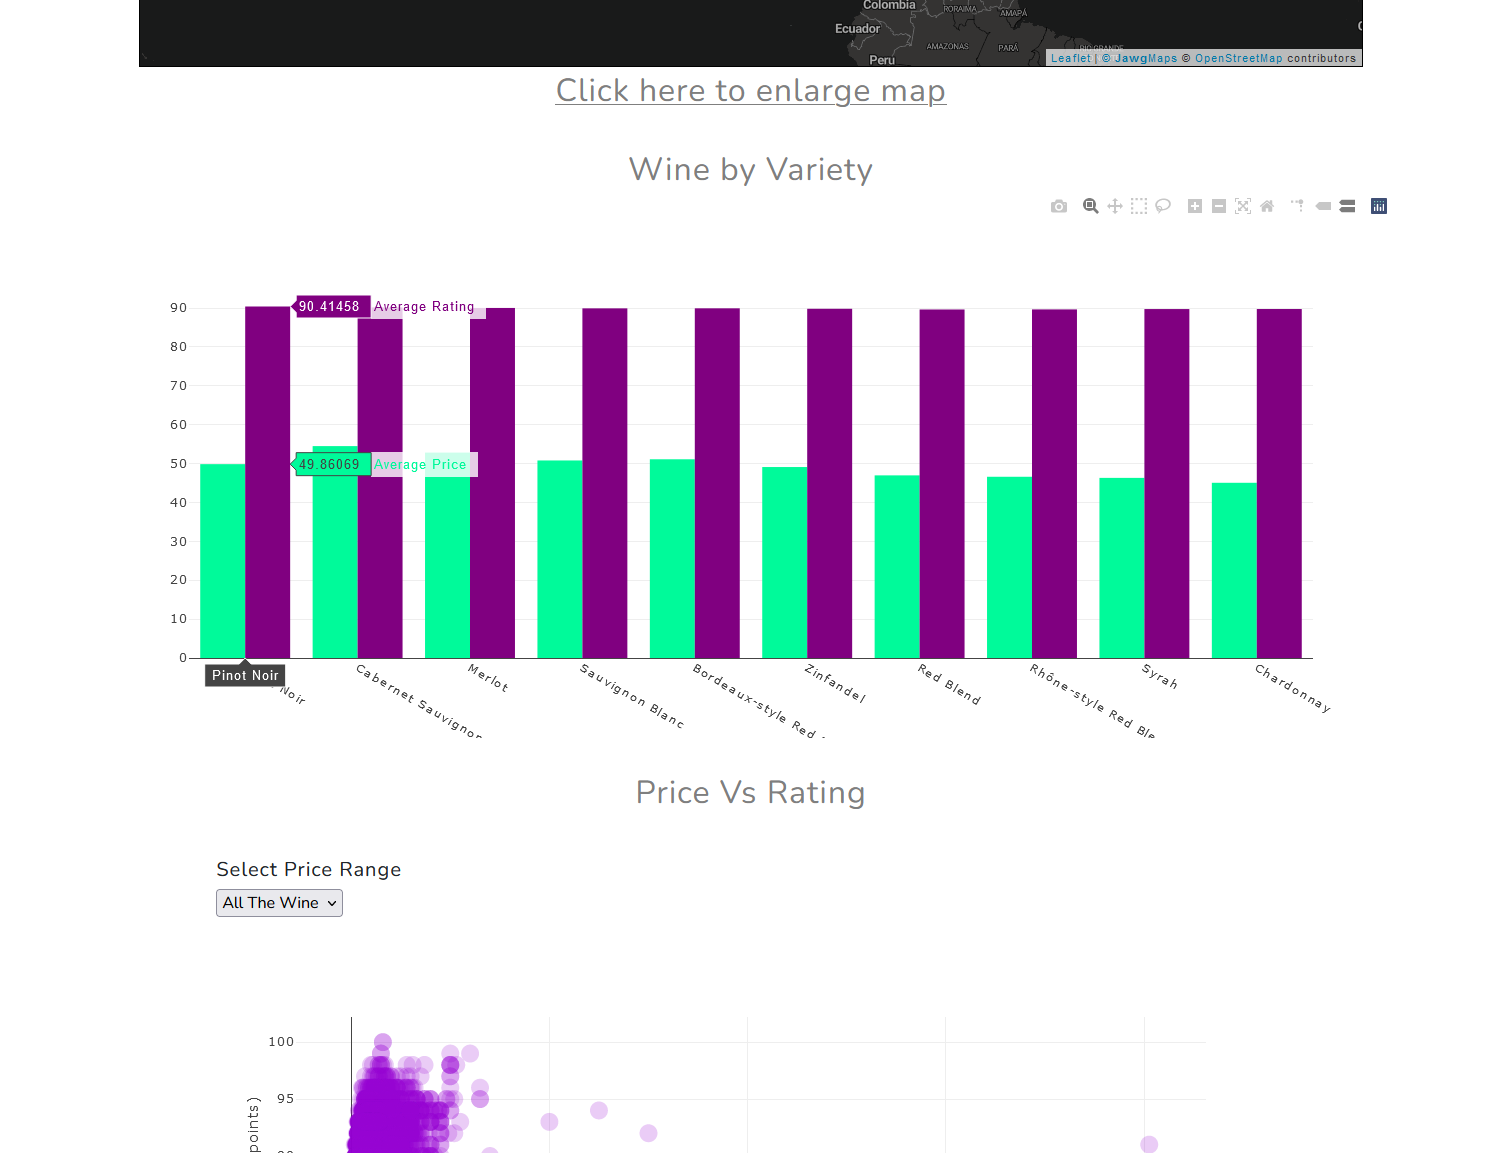
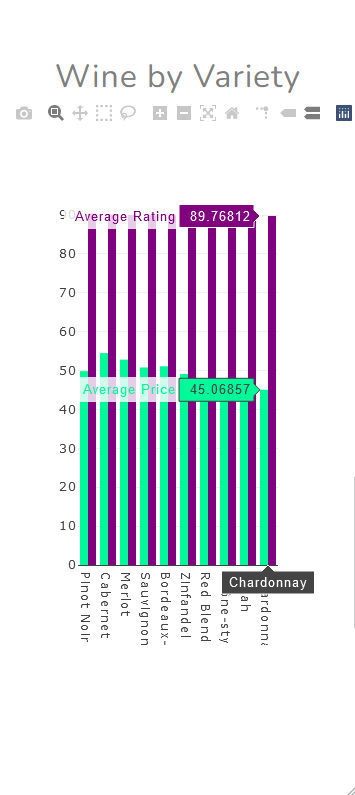
- Which types of wine have the highest ratings?
- Which types of wine command the highest prices?
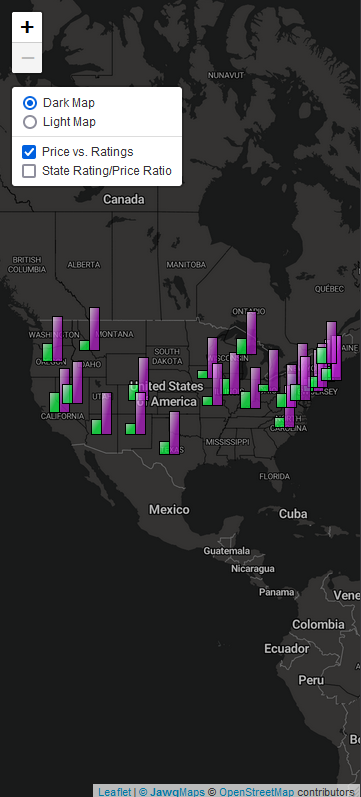
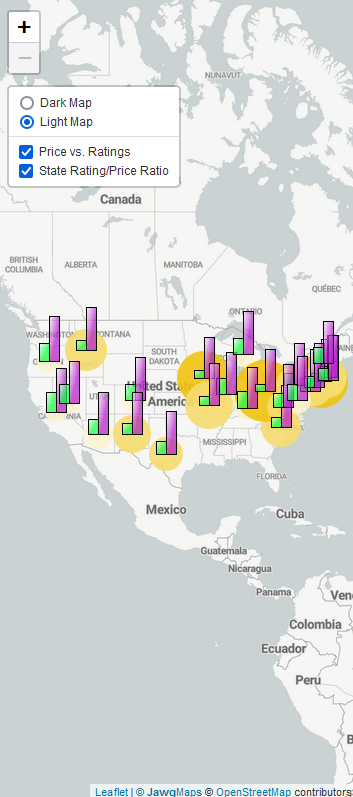
- Which states produce wines that command the highest prices?
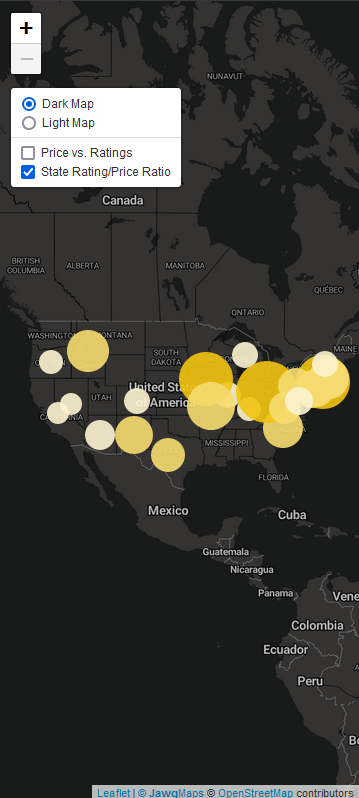
- Which states produce wines that have the highest ratings?
-
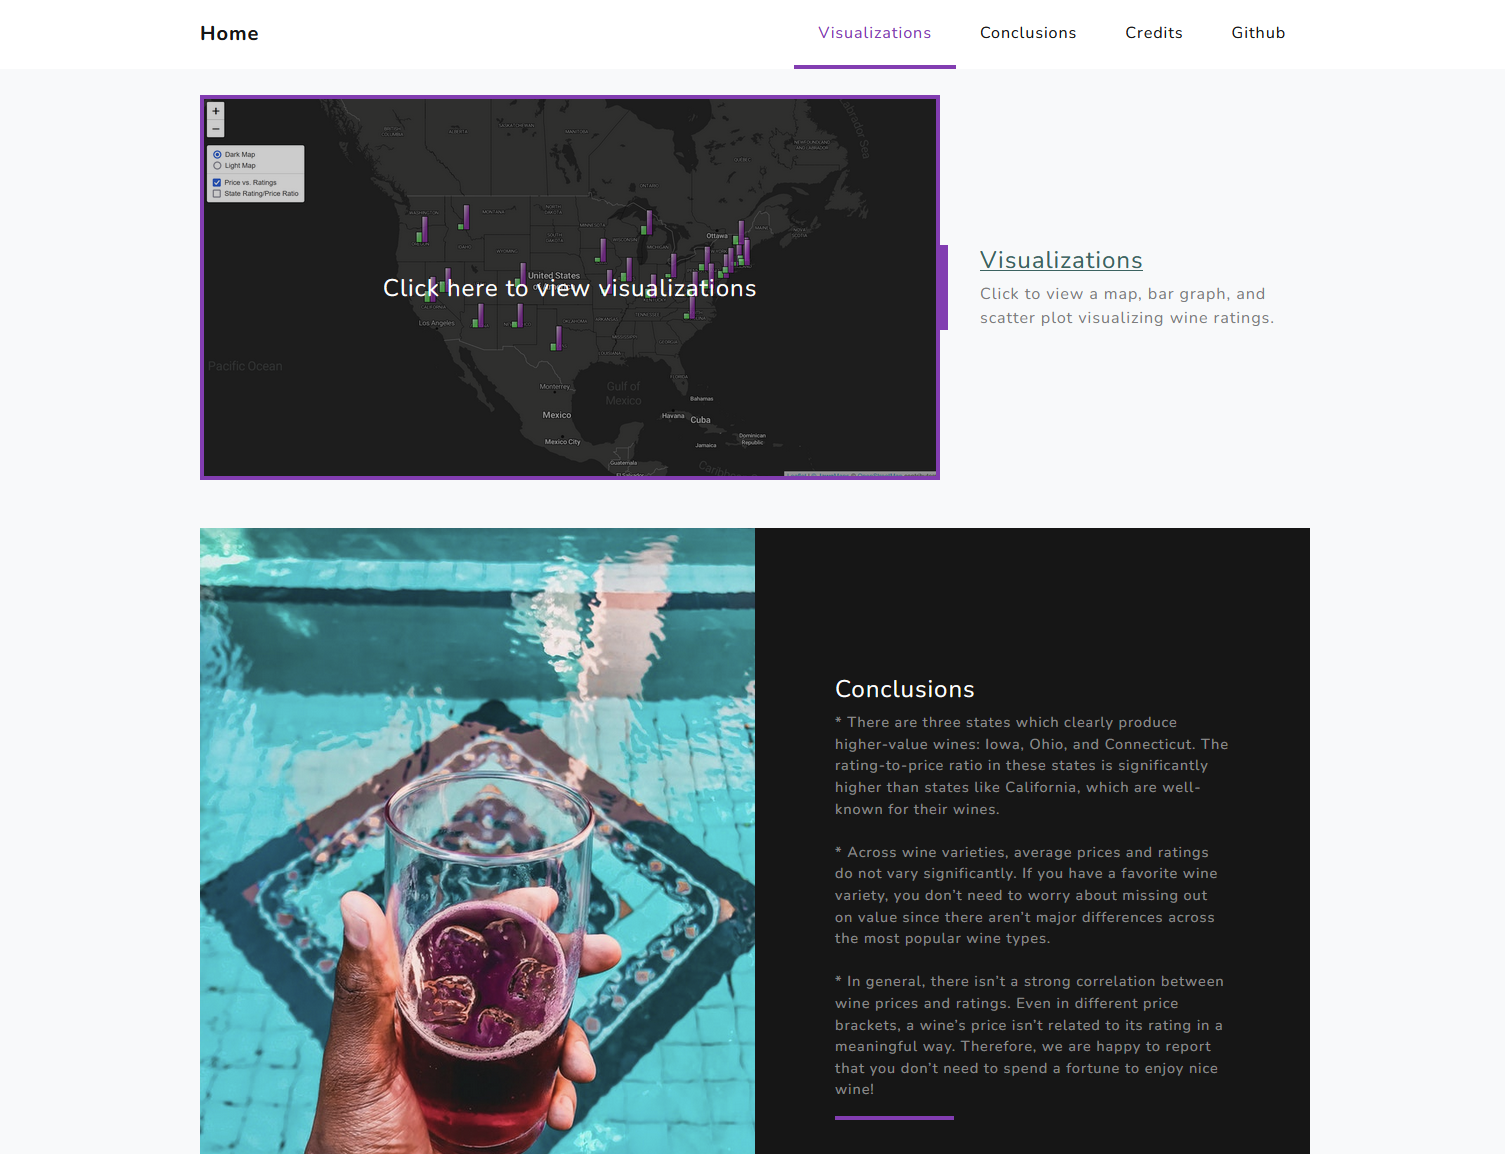
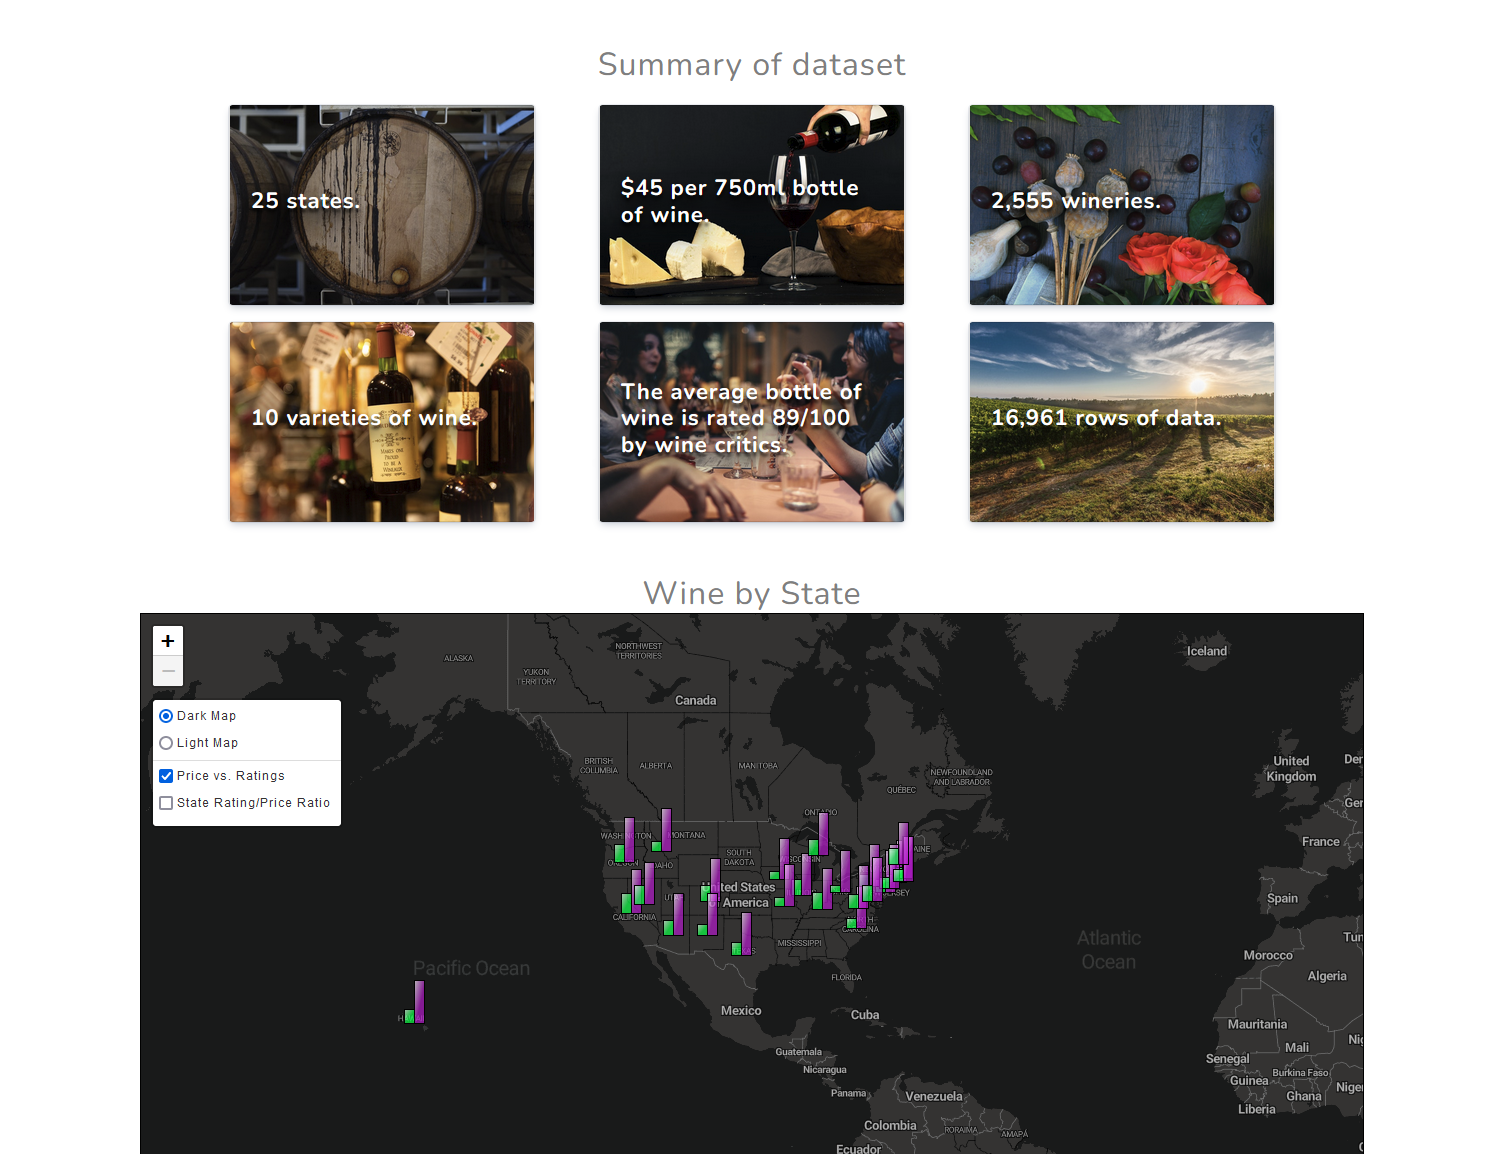
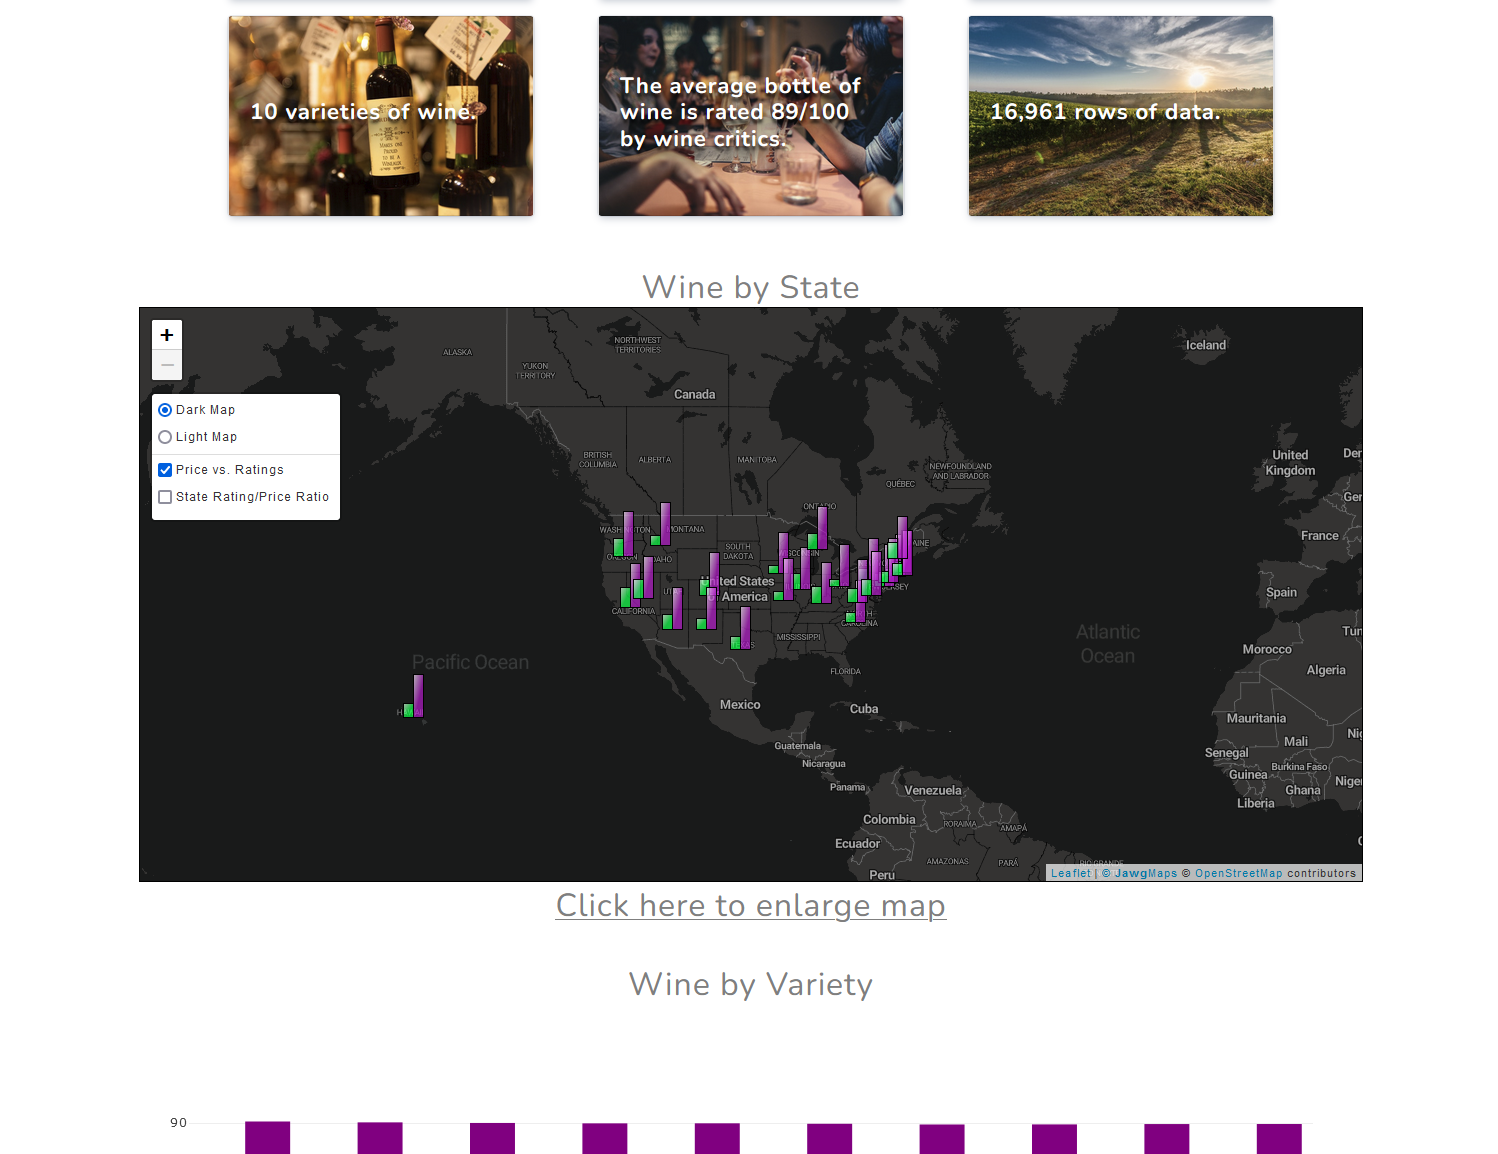
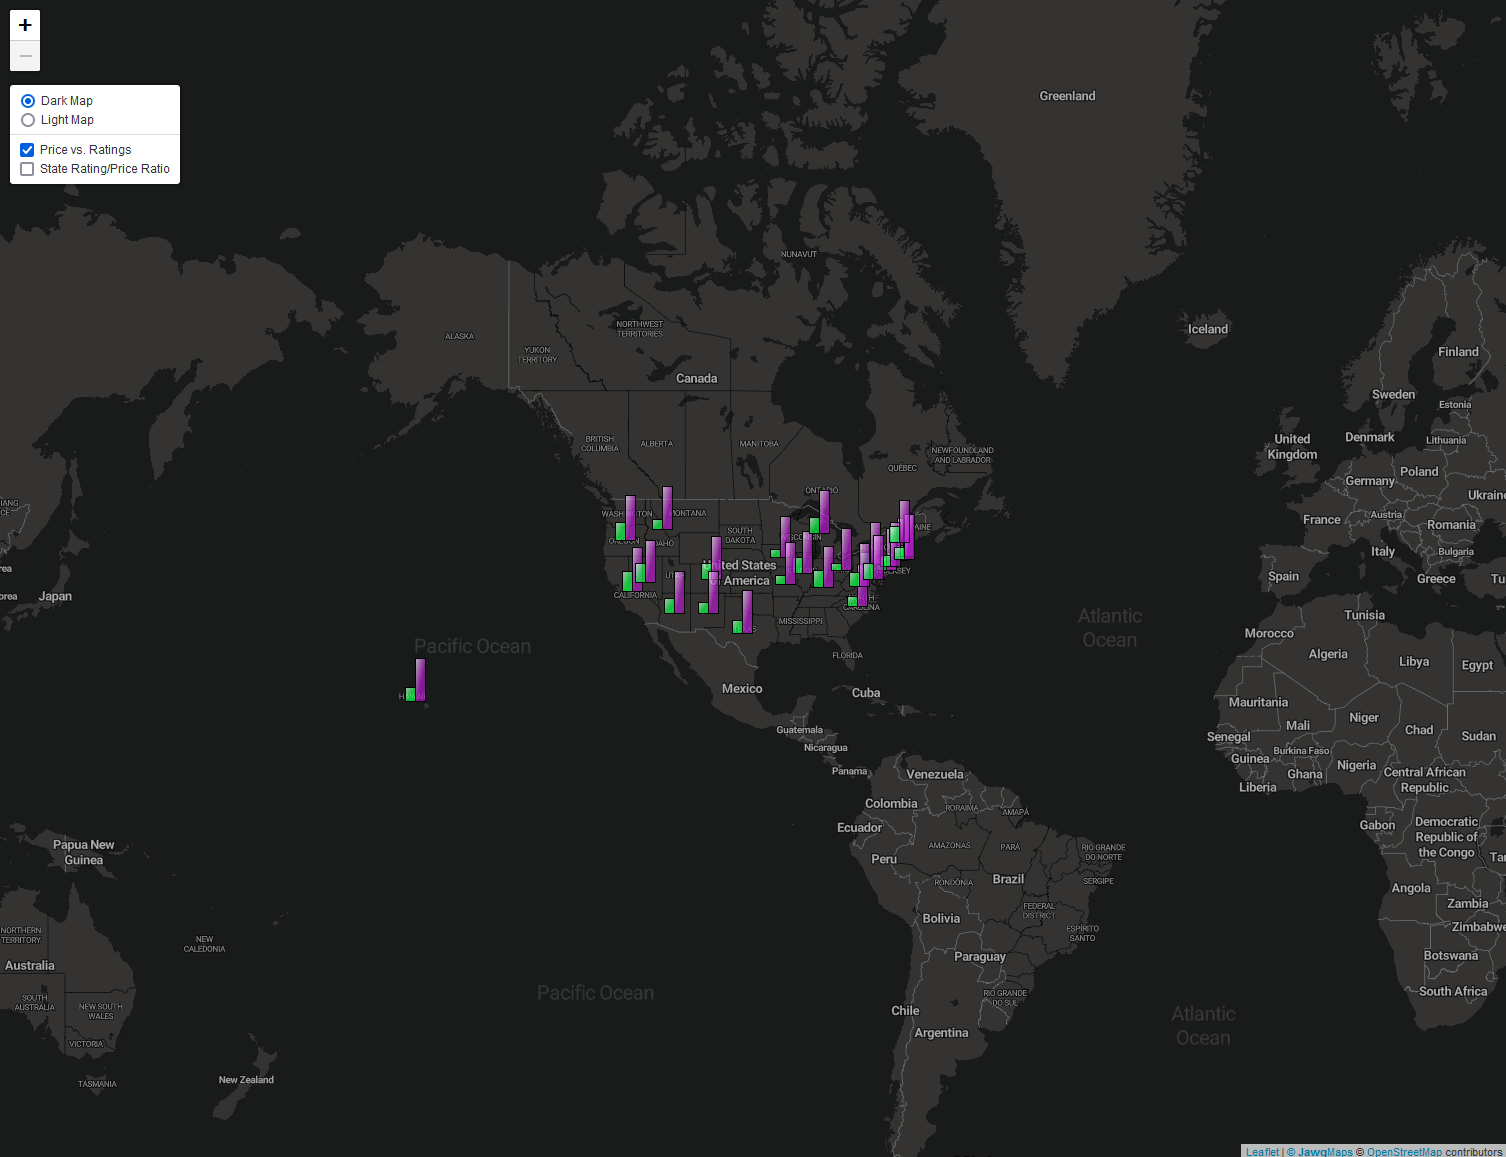
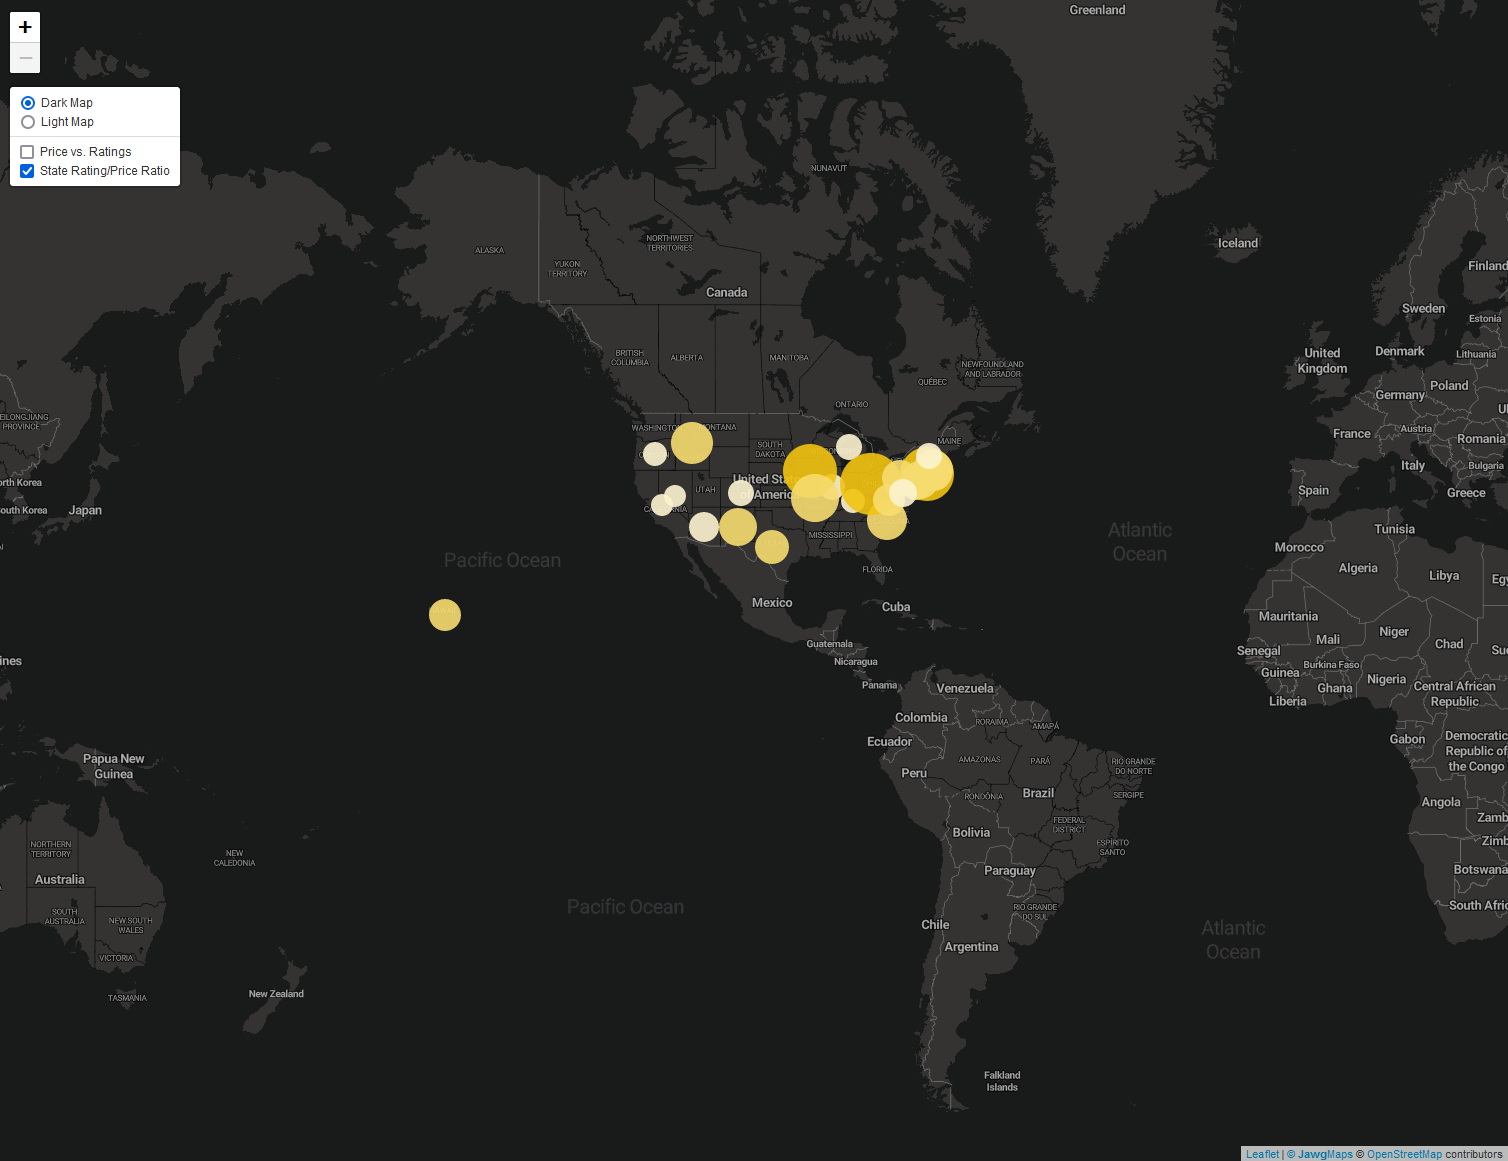
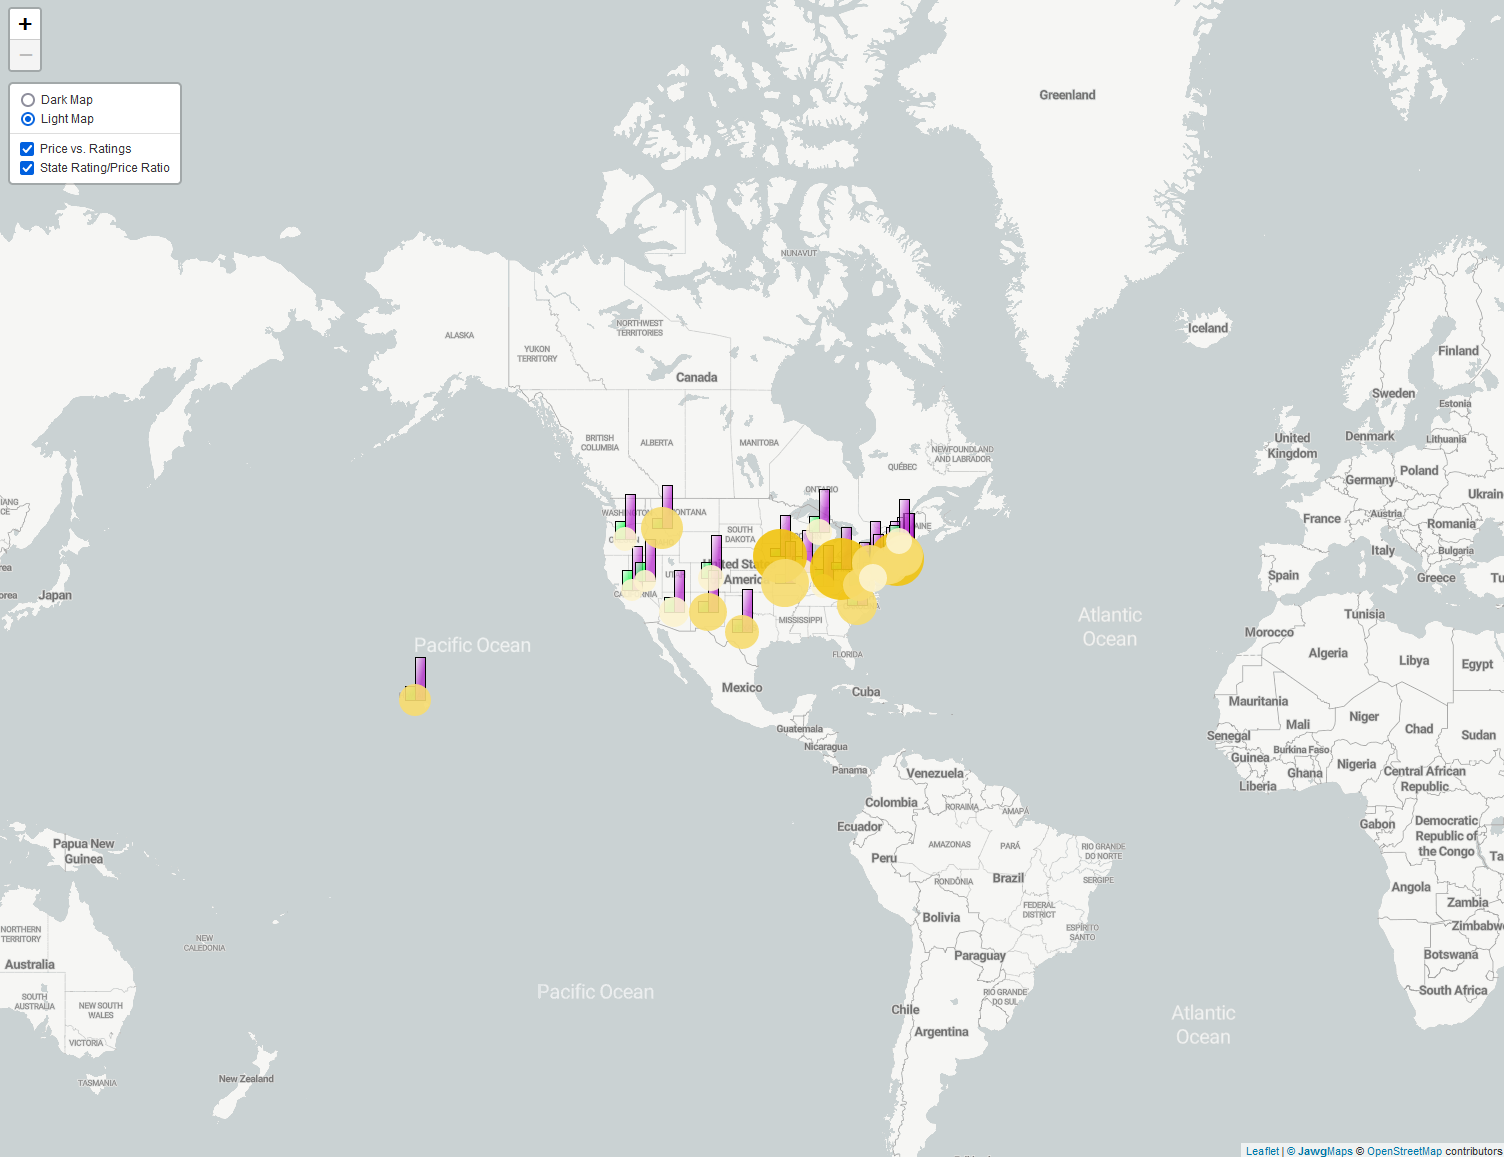
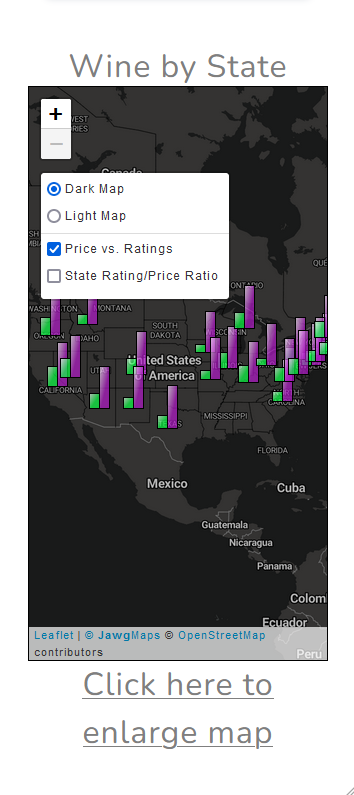
Map Layers:
- Bar graph markers showing average price and rating for wine grown in each state
- Production heatmap showing where the most wine is produced.
- Filter by wine variety to show where different types of wine are commonly produced.
-
Basic graphs (not on map):
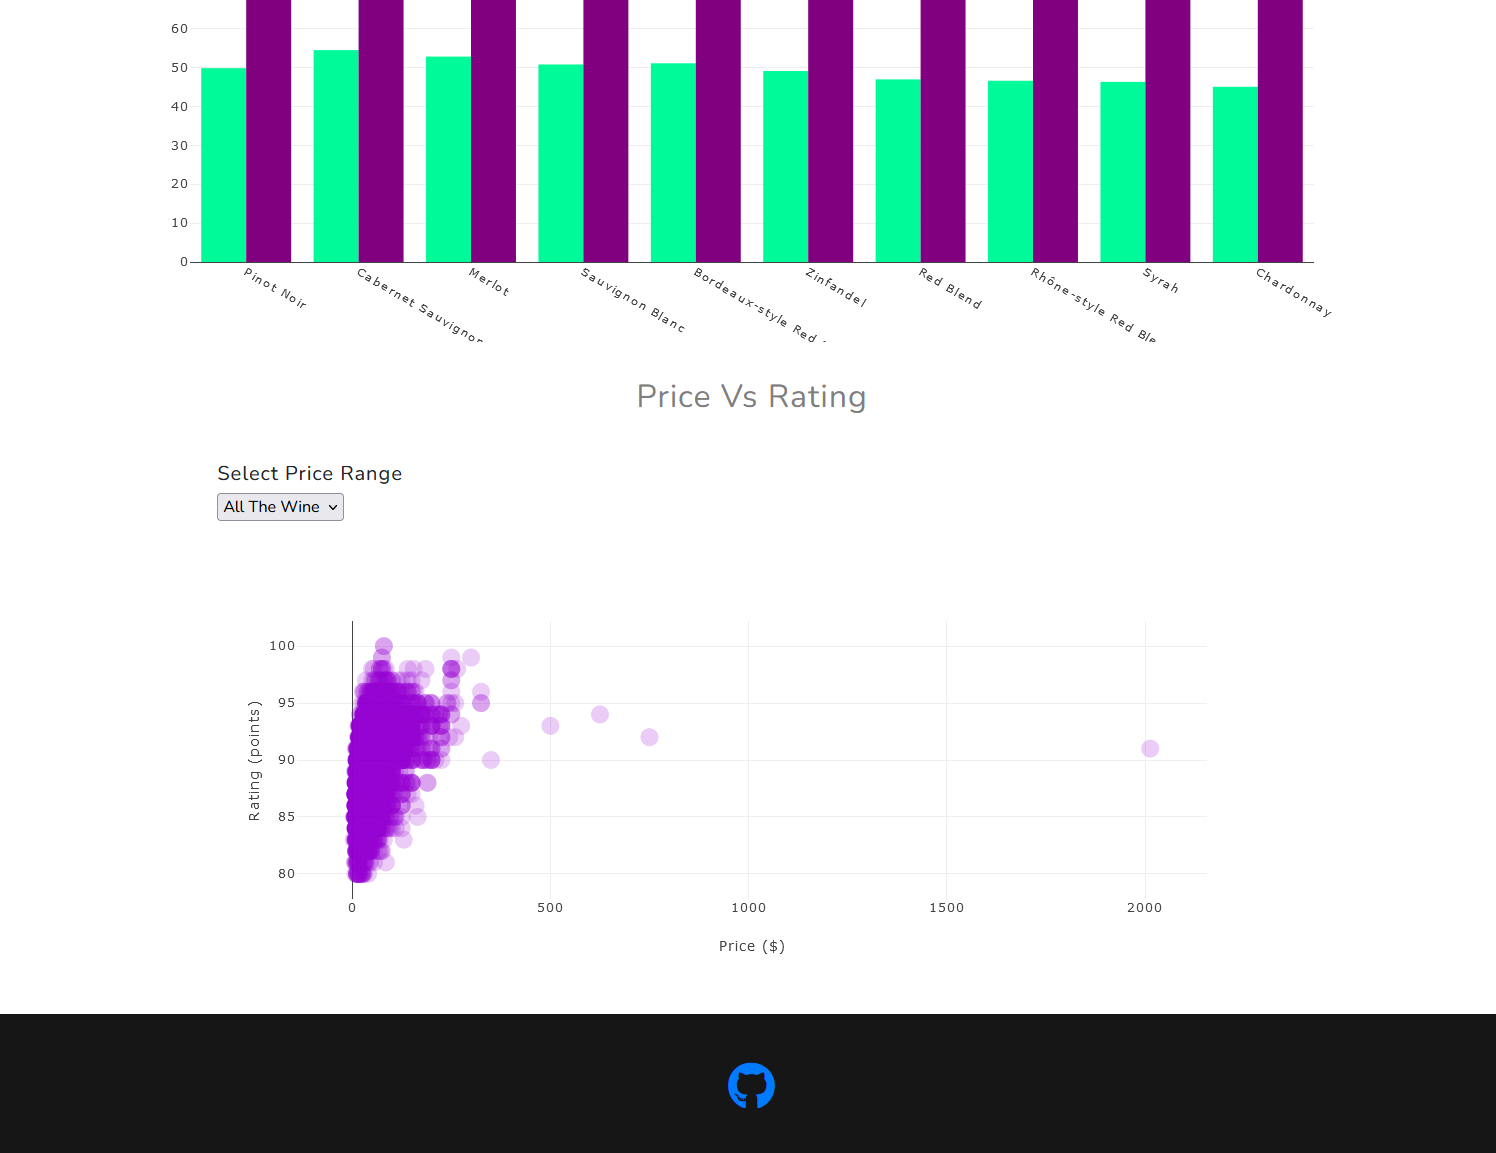
- Scatter plot showing the relationship between number of vineyards and avg wine price per state.
- Combined bar chart showing average bottle price for each wine variety and average rating per variety.
For our new JavaScript library, we will be using a leaflet plugin called "Leaflet Data Visualization Framework" to create bar chart markers for average price and average rating per state. Here is the GitHub link for this plugin: https://github.com/humangeo/leaflet-dvf.
Link to Dataset: https://www.kaggle.com/zynicide/wine-reviews/version/4?
Python version 3.8 (3.8.10 specifically) was tested and works for the current packages used in requirements.txt. Conversely, other versions such as Python 3.11 were tested and do not work thus will require an update to the aforementioned packages to resolve version conflicts.
- Data Wrangling (Python, Pandas, R)
- Storage (SQLite)
- Backend (Python, Flask)
- Frontend (JavaScript, Bootstrap 4, HTML5/CSS3)
- Containerization (Docker)
- Web Host (AWS)
Whether you are running the app directly on a Windows OS or indirectly via Docker, there are a few things you need to do in order to setup the application:
-
Create your own Open Street Map account and API key @ https://www.openstreetmap.org/user/new
-
Create a file named
apiKey.jsand place it in theapplication/static/jsfolder. -
Copy the contents of
apiKey.example.jsinto theapiKey.jsfile you just created wherein the value ofconst API_KEYis your Open Street Map api key. -
If you are trying to run this application directly on a Windows OS, you will need to install
Python 3.8. -
Otherwise, you will need to install Docker so you can run the application through Docker.
Assumes you are using a modern Windows client OS such as Windows 11 or Windows 10 and that Python 3.8 is installed.
It is assumed the user is at the root of this project and is using a UNIX style command line environment when referencing the CLI commands below.
Open terminal at root of this project then move into application/ directory:
cd application/
Create venv folder in application folder using Python 3.8:
python3.8 -m venv venv
Activate venv:
source venv/Scripts/activate
Install python packages to venv:
pip install -r requirements.txt
Start application:
python application.py
Firstly, confirm that Docker is installed and running. Next confirm that no other application is using port 5000 as port 5000 is needed for the Flask server. If you need to run Flask on an alternative port, you can modify the last line in the application/application.py file.
It is assumed the user is at the root of this project and is using a UNIX style command line environment when referencing the CLI commands below.
Open terminal at root of this project then move into docker/ directory:
cd docker/
Build Docker image and start Docker container:
docker compose up --build
Visit: http://localhost:5000 to use the application.