This repository contains codes and data used for analysis in the article "Noise-Induced Schooling of Fish". The first release is archived at 
Note: Codes have been tested in a Linux and Windows 10 machine. A few adjustments may be required for Mac users. For all the inputs set the working directory in MATLAB to where the input files are saved.
-
Detection: Detection of fish from a video can be done using the MATLAB code detection.m in
/tracking/detections.m.- Run the file detections.m which will prompt you to select the video for detection.
- Use sample video sample_vid.avi in the folder
/sampleas input for the code. - A figure pops up displaying a frame of the video. Click and drag to select the region where you want the fish to be detected, right click and select
copy position, minimize the window and hit ENTER on the MATLAB console to begin tracking.
-- Note: It could be the entire arena where the fish swim or a small region where they are isolated or is of interest, also make sure not to close the window after selecting the region, just minimize it.
-- The time to run this code would depend on the length of the video and your system. For the sample video provided by us it would take approximately 40 mins.- Individual fish are detected and their coordinates at every frame is stored in the folder
/sampleas detected_sample_vid.mat and detected_sample_vid.csv.
Note: Change 'steps' in the code to steps > 1 for skipping frames between detection.
-
Tracking: A MATLAB code
/tracking/loop_track.mcan be used for tracking individuals between frames. This code uses the Kalman-filter code which we downloaded from Mr Student Dave’s website tutorial. Compared to/tracking/detections.mthis code can be expected to take substantially less time.- Use detected_sample_vid.mat as the input when prompted.
- The output is a set of files with name as in tracked_sample_vid_###to###.mat, where ### is the start-frame number and end-frame number respectively in the .mat file. These files are also stored in the folder
/sample.
-
Stitching different output files: A MATLAB code
/tracking/meta_analysis.mcan be used to stitch the output data from above code loop_track.m into one single file called rawdata_track.csv. This output will be stored in the folder/sample.Note: Owing to size of video files, we have provided only a sample video for group size (N) 60.
- Generate polarization time-series for sample video: The MATLAB code
/data_analysis/op_calculate.mcan be used to compute the polarization/order parameter.- The input for this code is rawdata_track.csv in the
/sample. For the data used in the paper select the ones provided in/data/raw_data/. For e.g,/data/raw_data/15/raw_data15tr1.csvas input file. - The output vel_x, vel_y are saved as <file_name>_vel_x_y.mat for further analysis by the users.
- The input for this code is rawdata_track.csv in the
To generate Fig 2, we used different N and multiple trials for each N. To reproduce these plots, one must first generate the corresponding complete-time series (i.e. each trial of around 50 minutes at ~8 fps). To do this, run the rawdata files /data/raw_data for different N.
The time series and histogram plots are generated using vel_x and vel_y for various group size and trials.
- Drift and Diffusion functions can be computed by running the MATLAB code
/data_analysis/vector_drift_diff.m
Input required: (vel_x.mat and vel_y.mat) computed from vel_x, vel_y computed as explained in section ‘Codes for Figure 2’ or synthetically generated using /simulations/interact.m as explained in next section, ‘Codes for Figure 4’.
- A MATLAB code
/simulations/interact.mused for simulating the pairwise and ternary interaction models.- For pairwise set the parameter controlling ternary interaction rate (h) = 0 in the code with s = 0.25 and p = 4 in line 11 and sigma=3 in line 12.
- The outputs (polarization vectors) vel_x.mat and vel_y.mat are saved when required.
- The saved output can be used to plot drift and diffusion functions using the codes in
/data_analysis/vector_drift_diff.m
- For Ternary set the parameter controlling ternary rate (h)=0.3 in the code with s = 0.25 and p = 0.01 in line 11 and sigma=3 in line 12.(line 11).
- The outputs (polarization vectors) vel_x.mat and vel_y.mat are saved when required.
- The saved output can be used to plot drift and diffusion functions using the codes in
/data_analysis/vector_drift_diff.m
- For pairwise set the parameter controlling ternary interaction rate (h) = 0 in the code with s = 0.25 and p = 4 in line 11 and sigma=3 in line 12.
- In the folder
/Simulations/GAyou will find the codes to run Genetic algorithm optimization for identifying rates of interaction between fish and the order of alignment interactions.- In the sub-folder,
/Copyinginteractionsthe alignment model is based on a hierarchy of models where the fish copy the direction from another fish from a set k other fish. - In the sub-folder,
/averaginginteractionsthe alignment model is based on a hierarchy of models where the fish choose the average direction of k other fish.
- In the sub-folder,
For both the cases, Run the MainFile.m to begin the optimization.
For standalone codes of just the model (copying and averaging type), refer to the folder /GA/standalone.
-
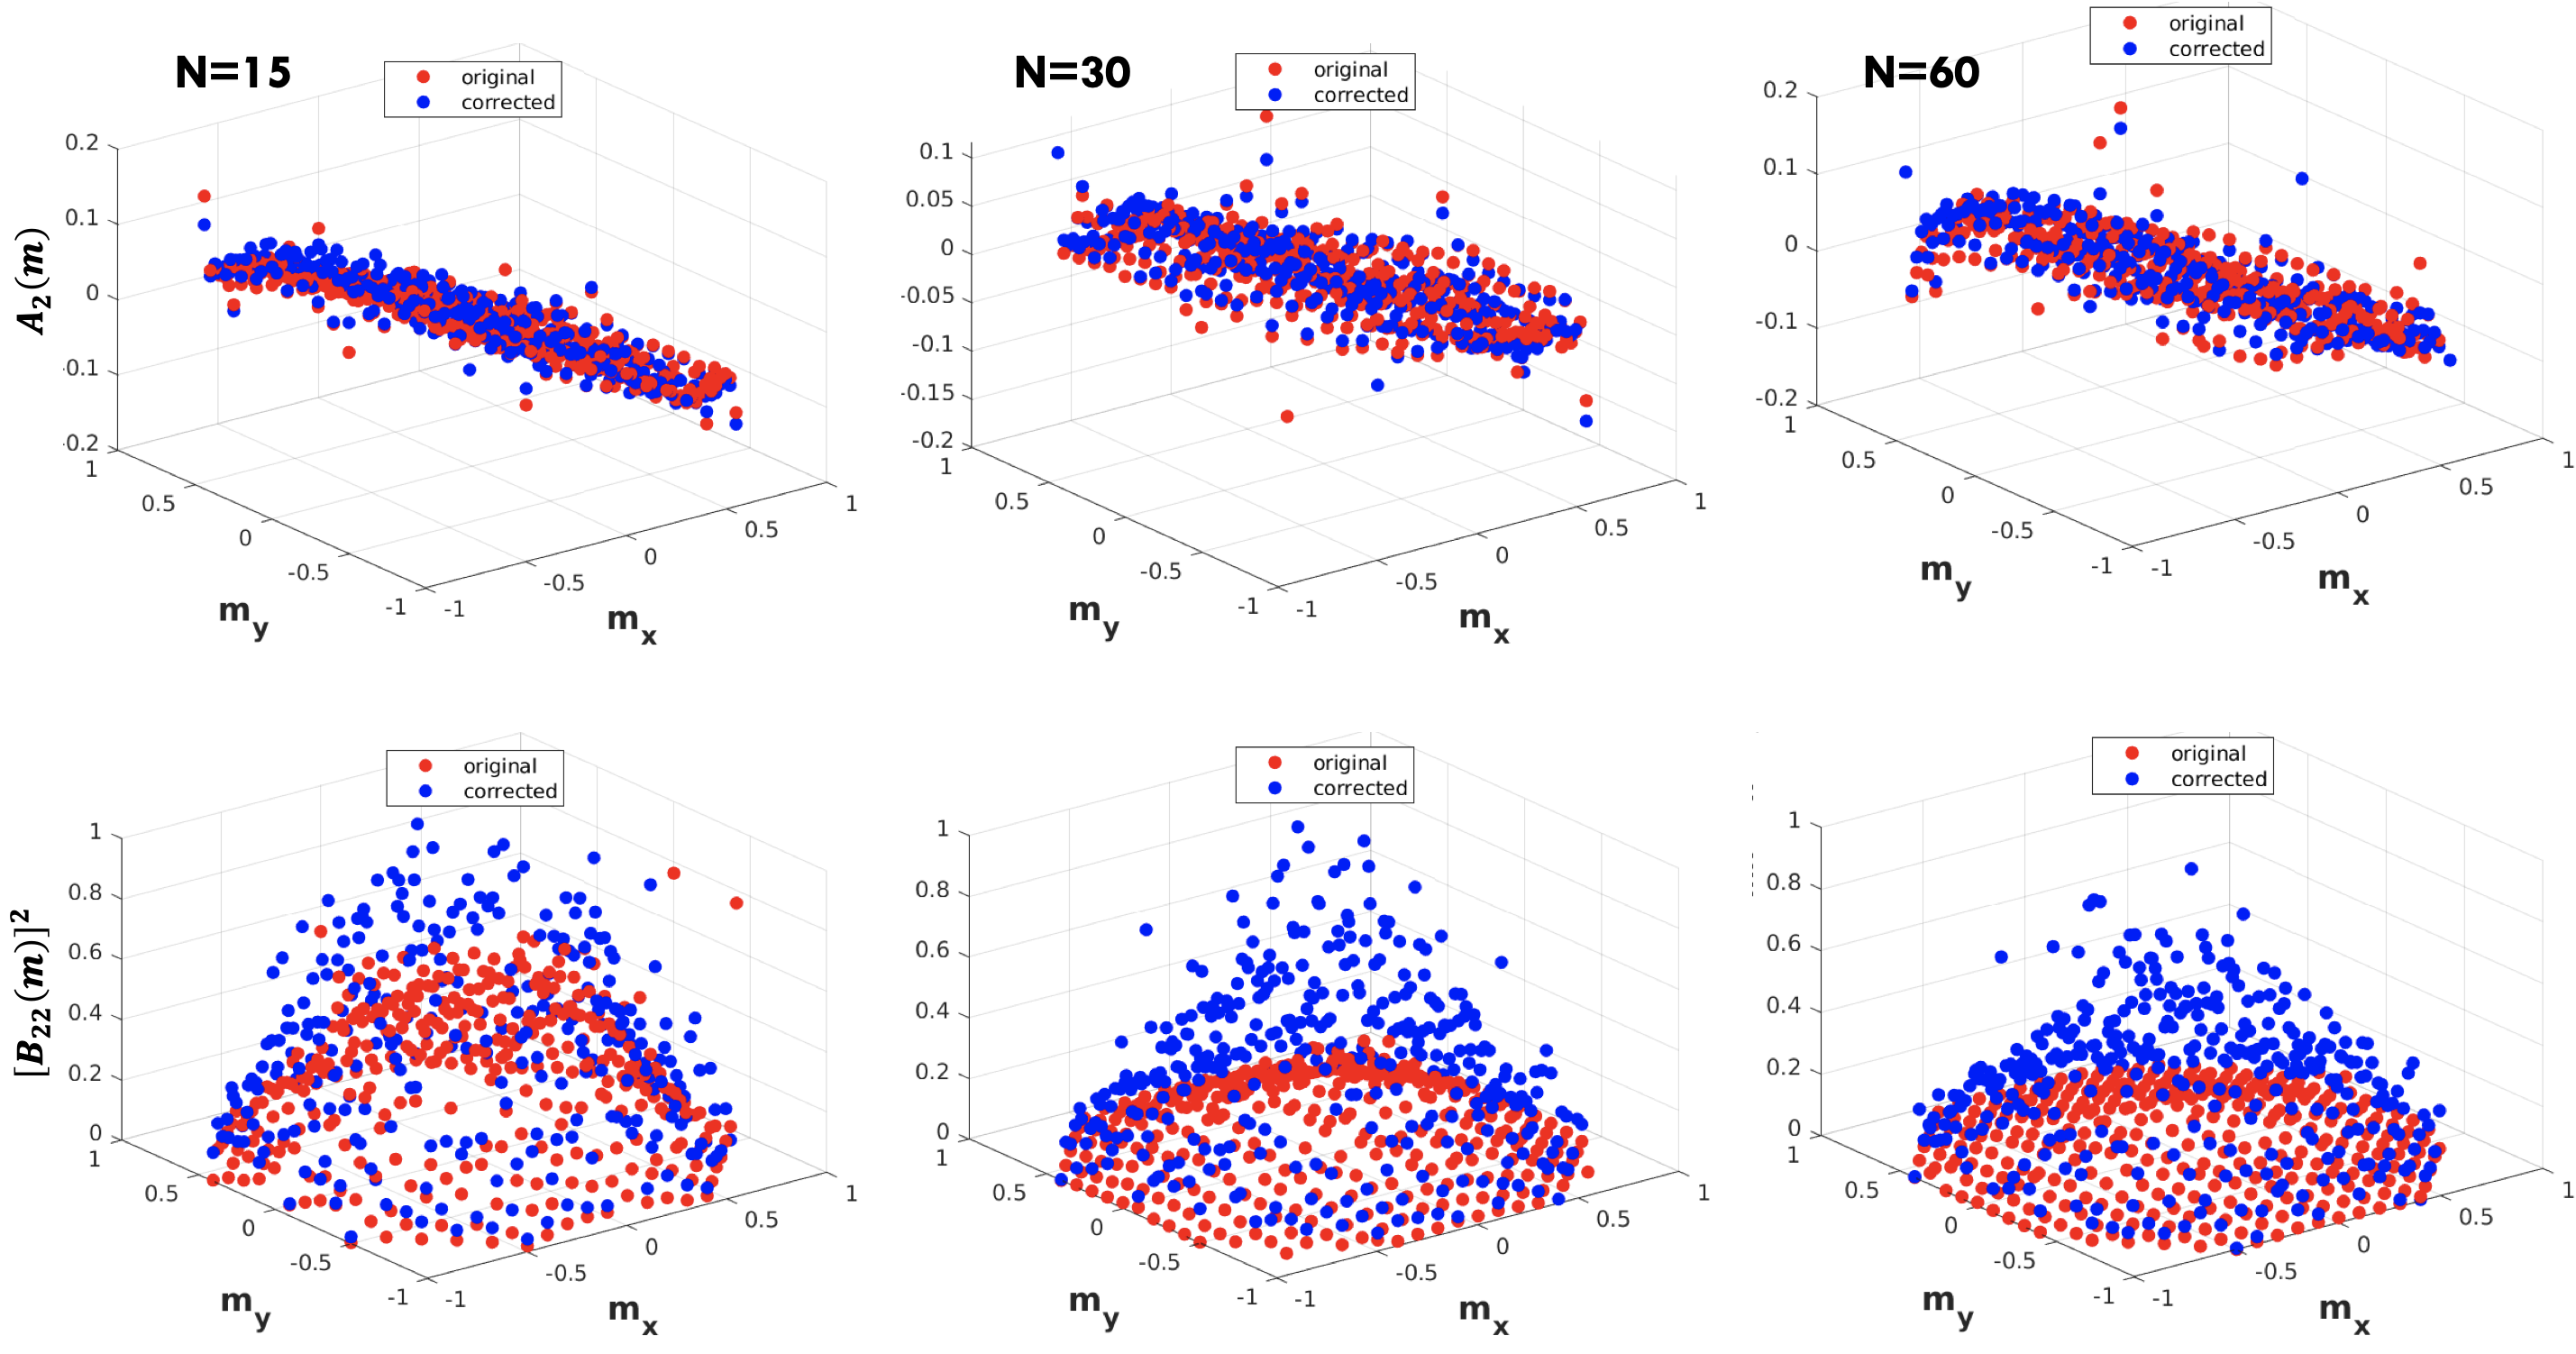
Tracking code is prone to errors due to the quality of videos and detection algorithm limitations. For example, we noticed sudden jumps in the estimation direction vectors of fish, but at a sufficiently low frequency. To ensure these errors do not affect our conclusions, we used a number of different approaches which includes, for example, discarding such individuals from the calculations of the order parameter for that instant. We found that the main conclusions (based on Fig 2 and 3 of the main text) do not change.
-
We show first and second jump moments for one such re-analysis below (this was not a part of the manuscript); we have removed individuals whose direction of motion across 0.12 seconds changed by more than 20 degrees.