Industrial facilities can emit a variety of toxic chemicals into the air. Depending on many factors, such as the processes being employed, each facility will emit a distinct type, amount, and group of chemicals. Certain chemical emissions are known to co-occur since they are typically present in specific processes. For example, benzene, toluene, ethylbenzene, and xylene are collectively referred to as BTEX compounds. These compounds are often found together in petroleum related industries since they are naturally found in crude oil. Formaldehyde and dioxins are other common toxins since they are released as byproducts of incomplete combustion and through a broad area of activities. This project performs network analysis and community detection on industrial facilities, which are linked based upon commonalities in their chemical emissions.
The U.S. Environmental Protection Agency’s Toxic Release Inventory (TRI) specifies the amount of toxic air releases for each industrial facility that reports to the database. Those facilities that are within specified industries and meet minimum thresholds report to this database on an annual basis. The reporting thresholds are 25,000 pounds of chemicals manufactured or processed, or 10,000 pounds otherwise used. Certain persistent and bioaccumulative chemicals have lower reporting thresholds. Dioxins and dioxin-like compounds have the lowest reporting threshold in the inventory at 0.1 grams over a calendar year.
This research was conducted in a Python and Jupyter notebook programming environment. The scripts are available for review within our Github repository. The data is initially brought into the buildNetwork.py file, which reads the TRI input data and parses it for building the network. Ultimately, we produce a dataframe where we have a record for each unique facility with attributes of chemical type and facility location.
We construct a non-directed network with industrial facilities as nodes and chemicals shared as edges. The buildNetwork.py file sets up the data as needed by the networkx library for Python and stores the necessary information into the graph. The edges are weighted based on the number of chemicals in common between two nodes.
We use the Louvain Modularity method to perform community detection. Modularity optimization and community aggregation are performed automatically according to this method. The communities are derived by maximizing intra-community edges while minimizing inter-community edges.
The resulting graph of 369 nodes contains 11,277 edges with an average degree of 61 and a modularity coefficient of 0.47.
The buildNetwork.py file outputs a describeNetwork.csv which contains all the nodes in the network as separate records. This file becomes a basis for analysis within the communityAnalysis.ipynb Jupyter notebook. The attributes of each record include the number of degrees, clustering coefficient, industry classification code, and list of chemicals pertaining to the node.
The buildNetwork.py file outputs a describeNetwork.csv which contains all the nodes in the network as separate records. This file becomes a basis for analysis within the communityAnalysis.ipynb Jupyter notebook. The attributes of each record include the number of degrees, clustering coefficient, industry classification code, and list of chemicals pertaining to the node.
The resulting graph of 369 nodes contains 11,277 edges with an average degree of 61 and a modularity coefficient of 0.47. Given a positive modularity, we are sure that the communities detected have not risen by chance. We look at degree centrality, and find that a subset of facilities share the same number of degrees at 68 and 70. Upon further review, we find that many of these facilities are either within the same industry, the same type of facility, or owned by the same parent entity.
We implemented a “topdict” function as well as a “bottomdict” function to print the top and bottom n facilities by degree centrality, along with their number of edges. We note that the facilities with the highest degree centrality are all large facilities that use a wide variety of chemicals. We modified “bottomdict” to additionally output the chemicals emitted by facilities, so that we could identify those chemicals shared by a minimal number of facilities which might represent niche industries with very specific and uncommon chemical emissions.
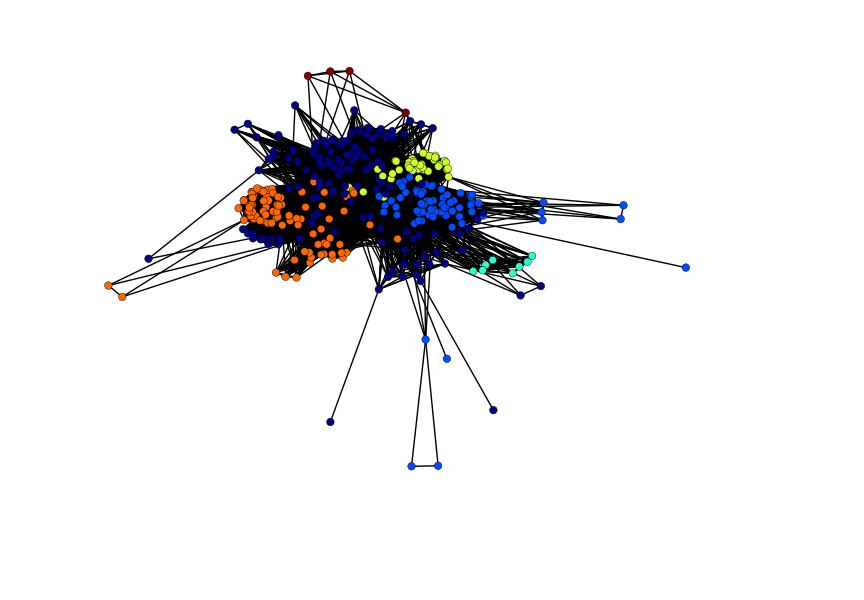
The Louvain Modularity community detection algorithm identifies six distinct communities, and the identified communities have industrial classification profiles that reflect the broad recognizable industrial categories. The results show the following for each respective community. We find the following predominant industries: Chemical and electronic in community zero, petroleum merchants for one, plastics in two, petroleum/coal manufacturing and merchants in three, semiconductors and metals in four, and metal fabrication in community five.
Lastly, we develop a potential method for fraud detection in terms of facilities that are not reporting to the TRI database. We focus on those facilities that are reporting for a given set of chemicals, yet are found to not be reporting for a certain chemical for which another facility in the same NAICS code and same community is reporting. We rank this list based on the number of counterparts found for a non-reporting facility. Further research would be necessary to validate this approach. See the Figures section for a portion of the output.
In conclusion, we produce results showing that the resulting network and detected communities correspond favorably to the North American Industry Classification System (NAICS), which is used to supply the industrial classification for each node. We also present a potential method for fraud detection and finding facilities that are not reporting to the TRI database. A next step would be to review the validity of such an approach by looking at each resulting facility from this method in detail to understand why there are no emissions of the given chemical being reported.
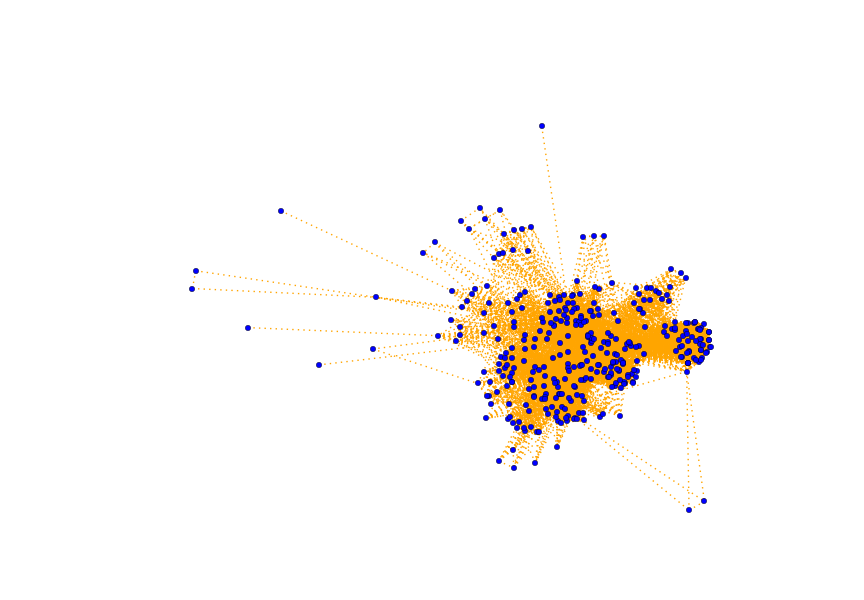
Non-directed network with no position specified for nodes
Non-directed network with community detection