Note: This repo is being archived in favor of the same repo under the Splunk Github account from which it was forked. Changes have been commited and merged into that repo.
The OSS Quorum App for Splunk contains a set of dashboards and analytics to give you full visibility into the system metrics, application data and ledger so that you can maintain security, stability and performance for your Quorum deployment.
These dashboards are meant to be a starting point for building analytics around your Quorum blockchain no matter where it is deployed.
In order to take full advantage of the dashboards provided there are 3 types of data sources that should be configured. Not all of these data sources are required to use the app, this is just a small taste of what is possible with Splunk and blockchain!
- Quorum Blocks, Transactions, and Events - These logs contain transaction information from the ledger itself and provide insight into operations and actions on-chain. We’ve open sourced Splunk Connect for Ethereum to help you easily ingest Quorum ledgers in Splunk.
- Quorum node logs and metrics - These are logs and metrics specific to a Quorum node. Specifically, Quorum application logs, Geth metrics, RPC data polled from different Quorum node endpoints (i.e. admin_peers, txpool_content, etc -- see Splunk Connect for Ethereum for more information).
- Infrastructure/System Level Metrics and Logs - System metrics such as CPU,MEM,DISK and NETWORK activity provide insight into the underlying infrastructure Quorum nodes are running on. These metrics/logs could come from physical machines, Docker, Kubernetes, IBM IKS, Microsoft Azure, Google’s GCP and AWS Cloudwatch to name a few. Splunk has different Add-ons and connectors for each.
There are a few dashboards provided to get you started with analyzing your Quorum deployment. These include:
- Data Setup - A dashboard to show you what data is being received by Splunk.
- Raw Data Flow - A dashboard showing the data flowing in from each Quorum node and data source.
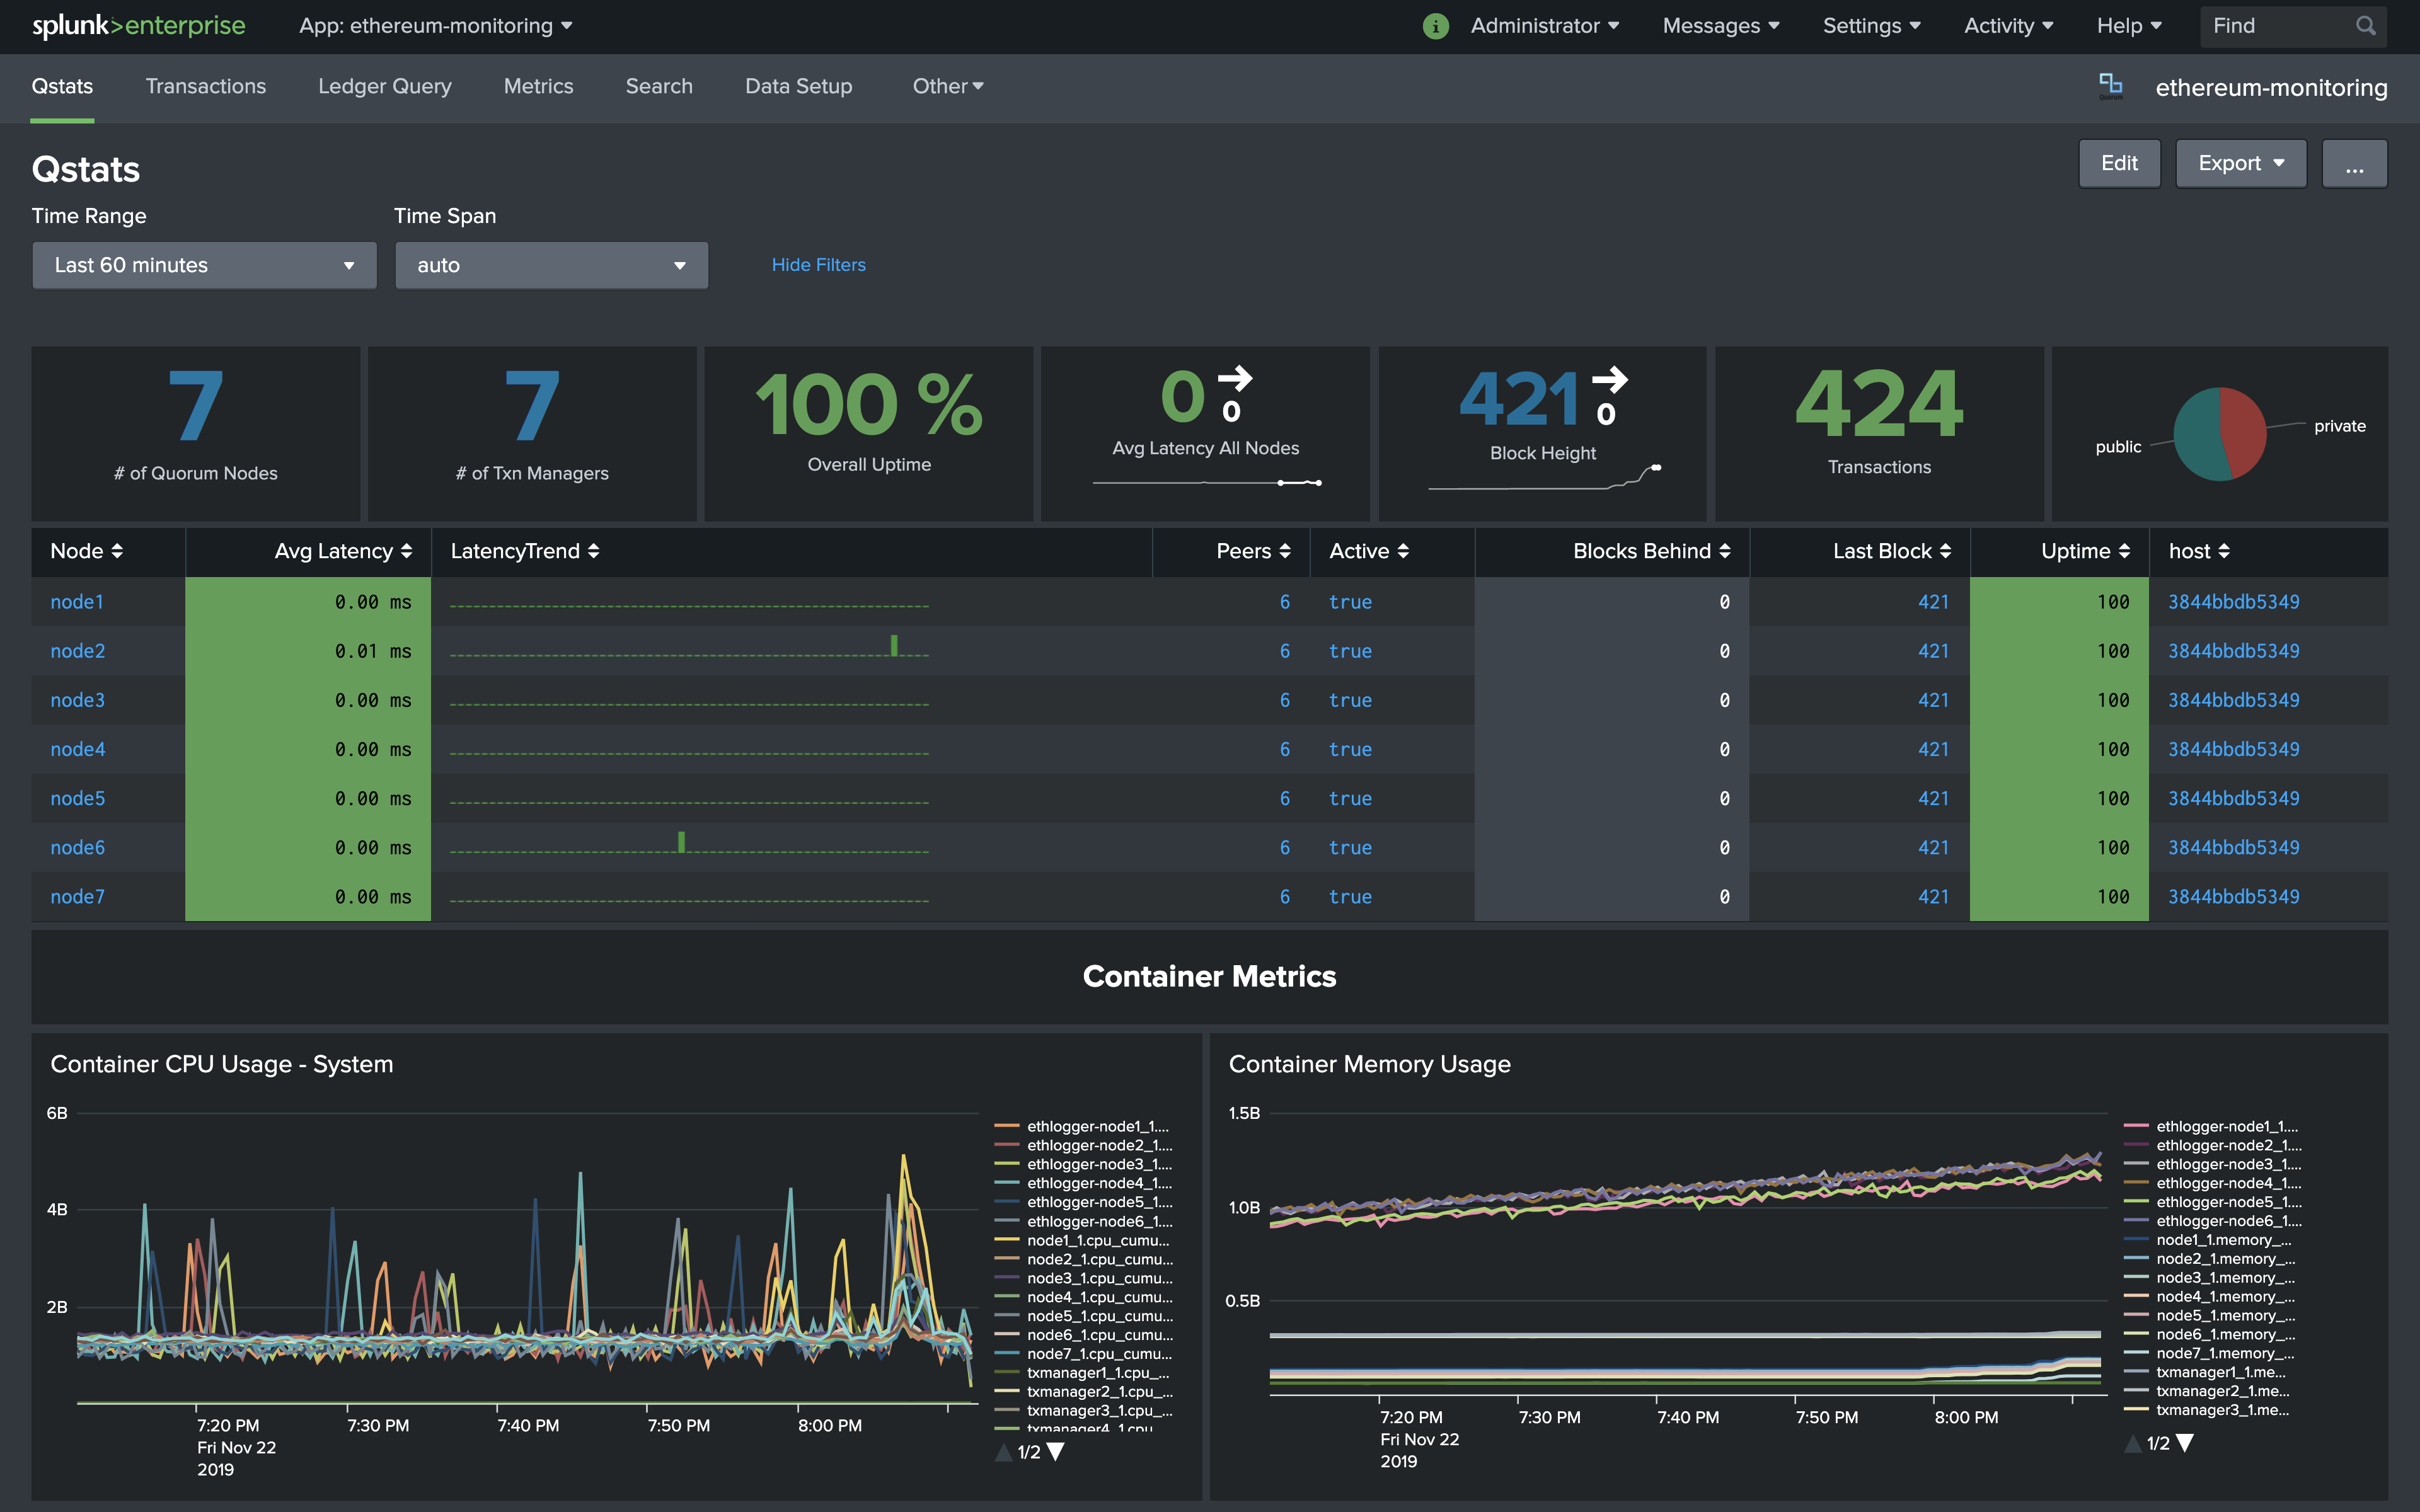
- Infrastructure Health and Monitoring - An overview of system health from system metrics like CPU, uptime status as well as transaction latency. You can see in real time when transactions are starting to back up or a node is falling behind on blocks.
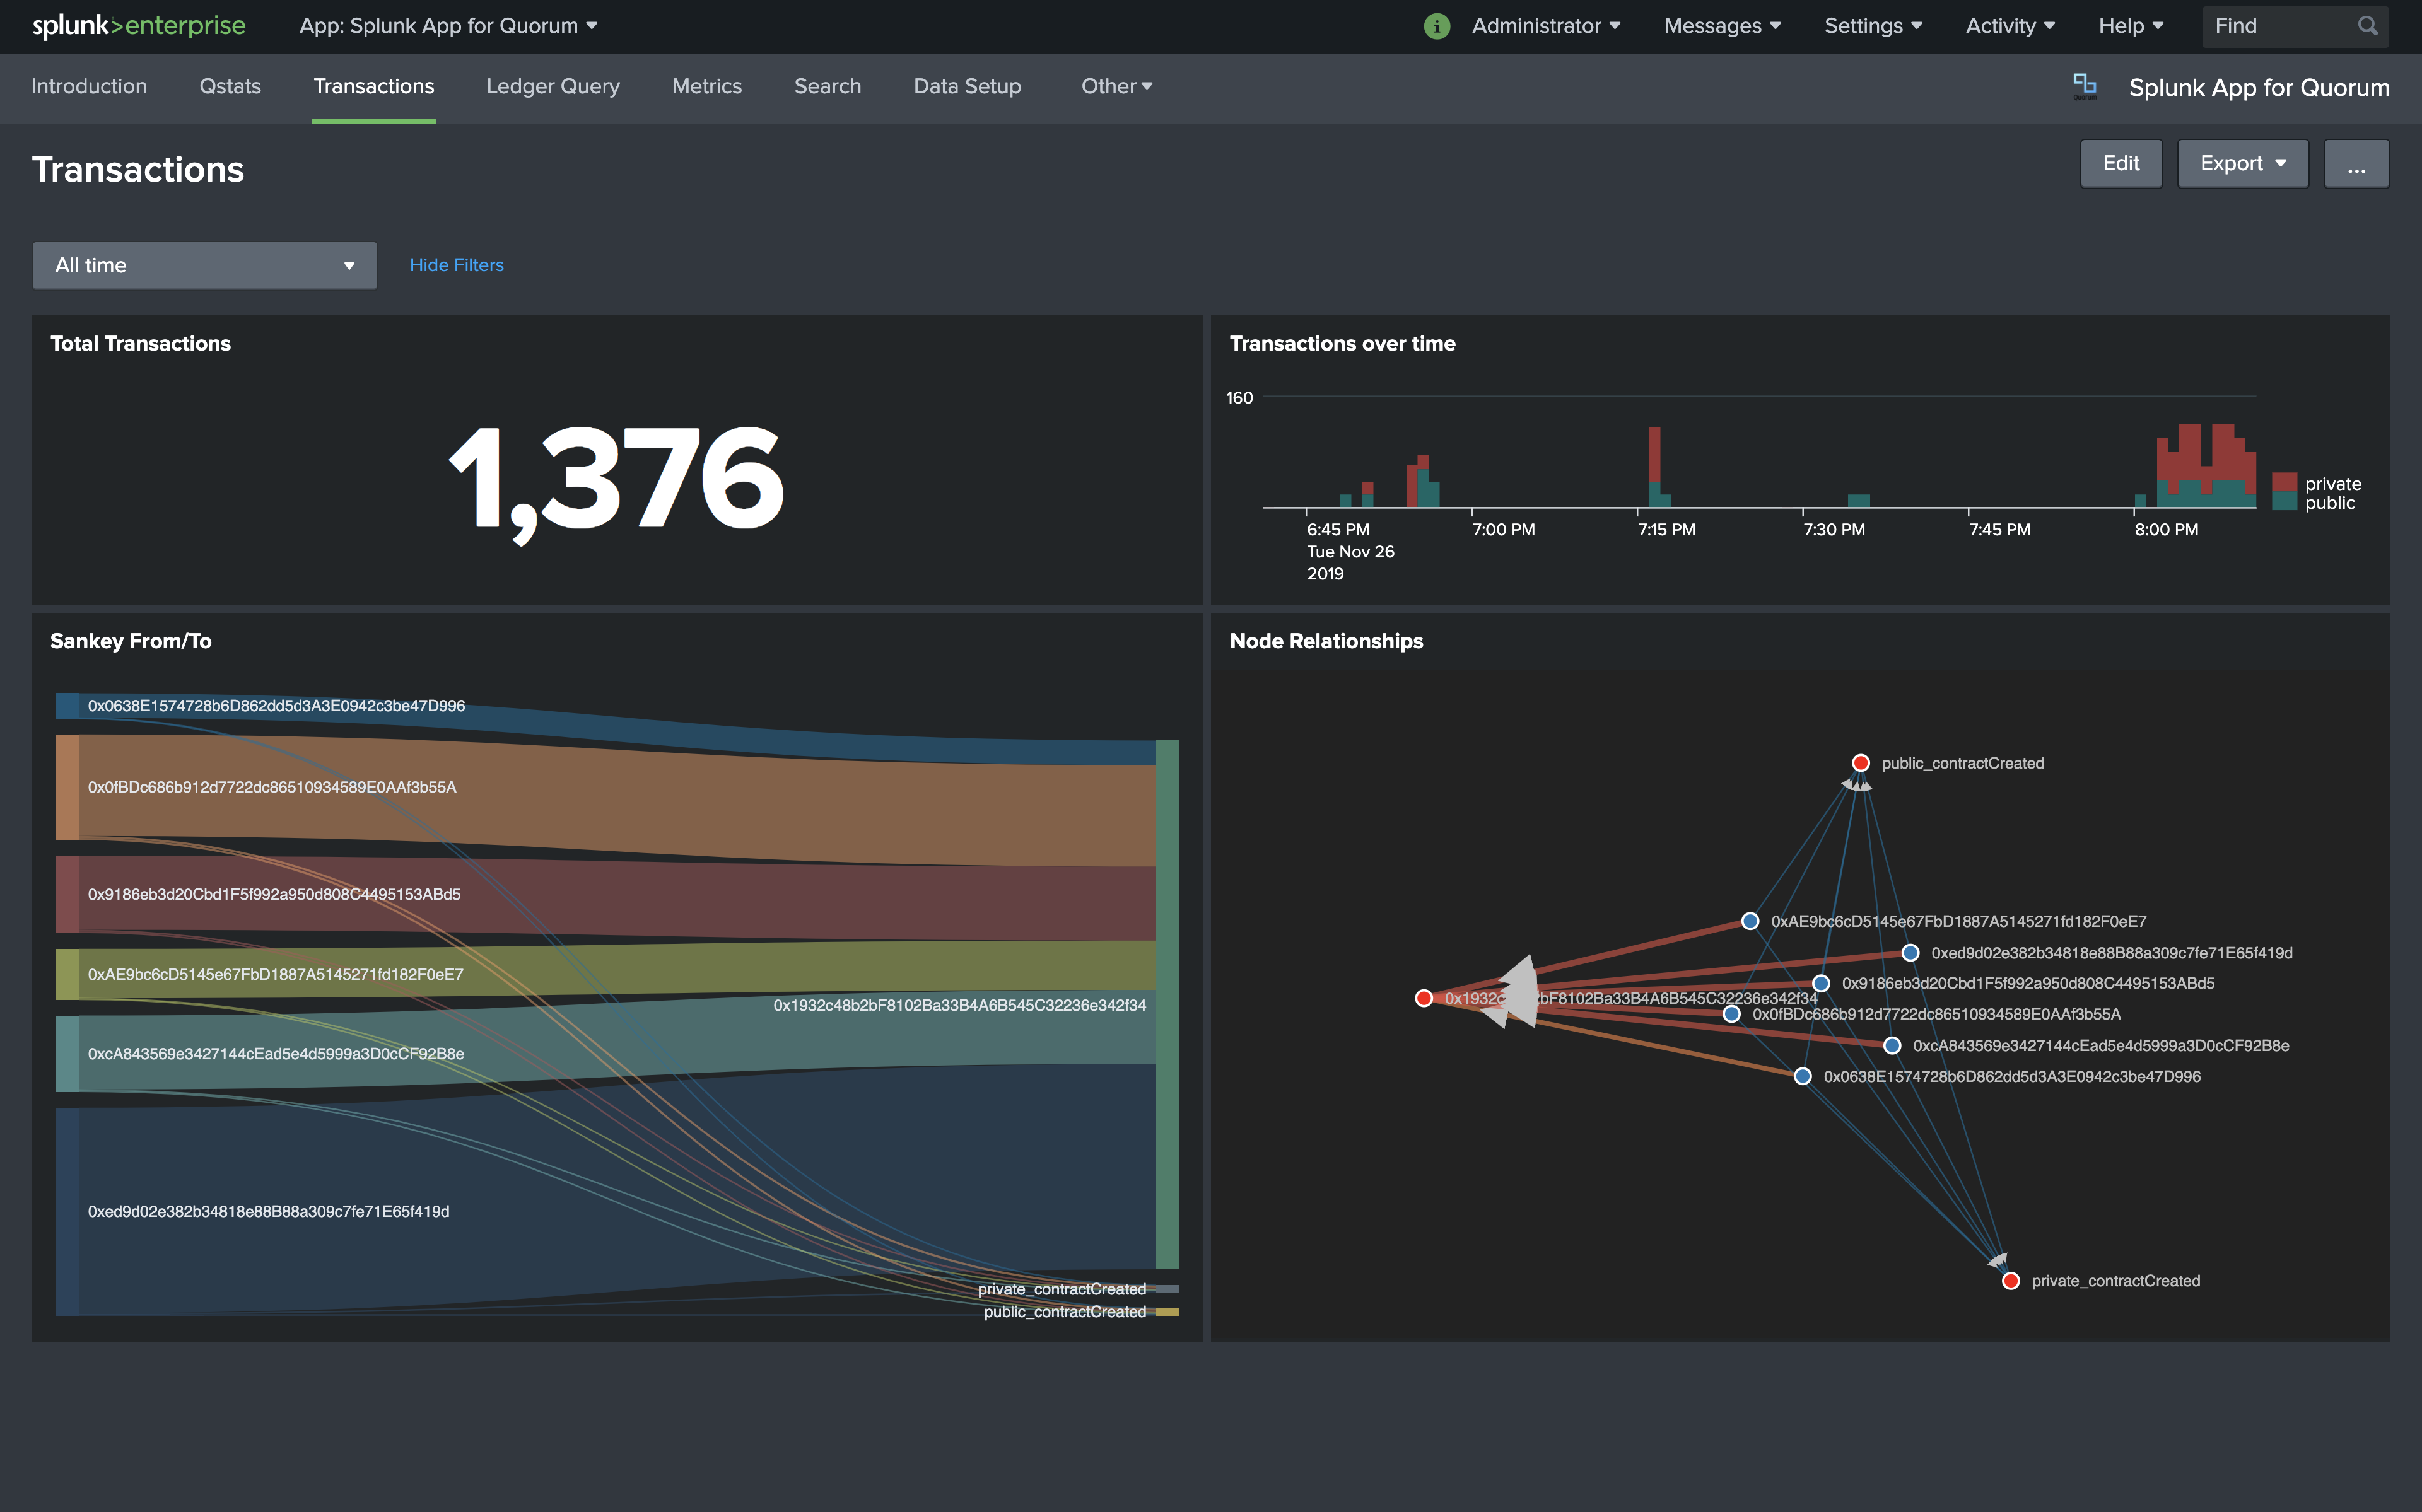
- Transaction Analytics - Real time visibility into the transactions being written on the ledger. See a breakdown of private vs public transactions and analytics around addresses.
- Ledger Query - Query the ledger using specific attributes to get detailed event data.

-
Install the App on a Splunk Enterprise Search Head that will have access to the data.
-
Open the App and navigate to the “Data Setup” dashboard from the Introduction Page.
-
Follow the instructions for each of the 3 data sources on the “Data Setup” page in order to populate the graphs and validate data is coming in correctly.
-
Quorum Block and Transaction Data - Splunk Connect for Ethereum is an open source agent that connects to each node on the Quorum network. See its README for deployment instructions. Docker, Kubernetes, and native deployments are all options.
-
Quorum node logs and metrics - You will need to create event and metric indexes in Splunk as well as an input mechanism to receive the data. We usually like to create an index called “ethereum” and “metrics” and enable the Splunk HEC to receive data. You can use the example “indexes.conf.example” provided in the app. Simply rename the file from “indexes.conf.example” to “indexes.conf” to enable the indexes, and rename “inputs.conf.example” to “inputs.conf” to enable the HEC endpoints. You will also need to enable the HTTP Event Collector (HEC) to receive data if it has not been "enabled" already.
$ cd $SPLUNK_HOME/etc/apps/splunk-app-quorum/default $ sudo mv inputs.conf.example inputs.conf $ sudo mv indexes.conf.example indexes.conf $ cd /opt/splunk/bin $ sudo ./splunk restart-
Quorum node JSON-RPC data - Quorum nodes also have RPC endpoints that Splunk Connect for Ethereum can poll and send to Splunk. This can be used to monitor transaction pool activity on a node, active peers, or leader election in Raft or Istanbul. In order for this to work, the required endpoints need to be whitelisted on the Quorum node. See the README at Splunk Connect for Ethereum for more information.
-
System Logs/Metrics - Depending on how you’ve deployed your Quorum network, there is probably a great option to get your System Logs and Metrics for end-to-end visibility. On the data setup dashboard, we’ve provided a list of common options that you can use to get your data into Splunk.
Below is a list of possible environments:
- Docker: Splunk Docker Logging Driver
- Kubernetes: Splunk Connect for Kubernetes
- Syslog: Monitoring Network Ports in Splunk
- Log File: Monitoring Files and Directories with Splunk
- IBM Cloud Platform: IBM Cloud Platform
- Microsoft Azure: Splunk Add-on for Microsoft Cloud Services
- AWS Cloudwatch: Splunk App for AWS
- GCP Stackdriver: Splunk Add-on for Google Cloud
-
You are now ready to use the OSS Quorum App for Splunk!
Copyright 2021 Splunk Inc.
Licensed under the Apache License, Version 2.0 (the "License"); you may not use this file except in compliance with the License. You may obtain a copy of the License at
http://www.apache.org/licenses/LICENSE-2.0
Unless required by applicable law or agreed to in writing, software distributed under the License is distributed on an "AS IS" BASIS, WITHOUT WARRANTIES OR CONDITIONS OF ANY KIND, either express or implied. See the License for the specific language governing permissions and limitations under the License.