Generates simple graphical user interfaces for manipulating and animating custom plots (inspired by the Mathematica function manipulate and implemented as an extension of John Verzani's gWidgetsManipulate package which in turn is modeled after RStudio's manipulate package).
NOTE: this packages is no longer in active development. If I had time I would reimplement it in Shiny so it allows easy generation of responsive browser based plot exploration apps.
The user interface in this package is generated using GTK+, a cross-platform toolkit for graphical user interfaces (http://www.gtk.org/). Unlike gWidgetsManipulate which can render the GUI both with GTK and tcltk, the event loop structure of tcltk unfortunately does not work with this implementation of the animation controls so GTK needs to be installed prior to using the animanipulate package but the installation is fairly straight forward (there is a known problem with the newest version of GTK on Mac OS, details in the installation instructions). If R and GTK are already installed and running on your system, you can go straight to installing the animanipulate package.
Hadley Wickham's devtools package provides a very easy way to install animanipulate directly from GitHub. To install devtools, run the following command in R:
install.packages('devtools', depen=T) # development tools
Then install the animanipulate package from GitHub using devtools:
library(devtools)
install_github('animanipulate', 'sebkopf')
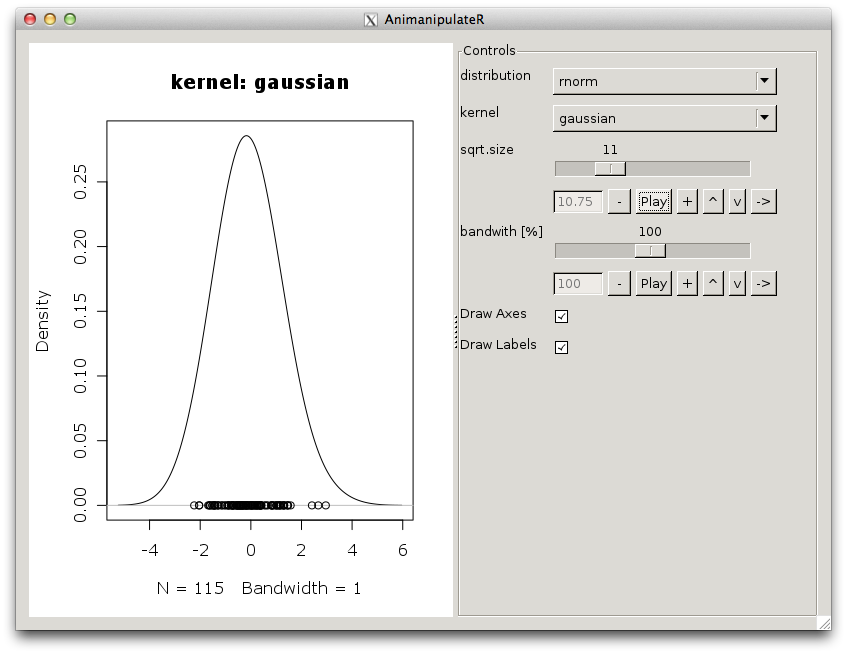
The following example code generates the GUI pictured in the screenshot above. This will work with any plotting function and automatically generates animation controls for all slider controls.
library(animanipulate)
manipulate(## expression
{
  size <- sqrt.size^2
  y <- get(distribution)(size)
  plot(density(y, bw = bandwidth/100, kernel=kernel),
       axes = axes, ann = label,
       main = paste("kernel:", kernel))
  points(y, rep(0, size))
},
## controls
distribution = picker("rnorm", "rexp"),
kernel = picker("gaussian", "epanechnikov",
                "rectangular", "triangular", "cosine"),
sqrt.size = slider(5, 30, step = 1, init = 10),
bandwidth = slider(5, 200, step = 5, init = 100,
                   label = "bandwith [%]"),
axes = checkbox(TRUE, label="Draw Axes"),
label = checkbox(TRUE, label="Draw Labels")
)