Numerical precision of euclidean_distances with float32 #9354
Comments
|
Same results with python 3.5 : It happens only with euclidean distance and can be reproduced using directly I couldn't track down further the error. |
|
numpy might use a higher precision accumulator. yes, it looks like this
deserves fixing.
…On 19 Jul 2017 12:05 am, "nvauquie" ***@***.***> wrote:
Same results with python 3.5 :
Darwin-15.6.0-x86_64-i386-64bit
Python 3.5.1 (v3.5.1:37a07cee5969, Dec  5 2015, 21:12:44)
[GCC 4.2.1 (Apple Inc. build 5666) (dot 3)]
NumPy 1.11.0
SciPy 0.18.1
Scikit-Learn 0.17.1
It happens only with euclidean distance and can be reproduced using
directly sklearn.metrics.pairwise.euclidean_distances :
import scipy
import sklearn.metrics.pairwise

# create 64-bit vectors a and b that are very similar to each other
a_64 = np.array([61.221637725830078125, 71.60662841796875,    -65.7512664794921875],  dtype=np.float64)
b_64 = np.array([61.221637725830078125, 71.60894012451171875, -65.72847747802734375], dtype=np.float64)

# create 32-bit versions of a and b
a_32 = a_64.astype(np.float32)
b_32 = b_64.astype(np.float32)

# compute the distance from a to b using sklearn, for both 64-bit and 32-bit
dist_64_sklearn = sklearn.metrics.pairwise.euclidean_distances([a_64], [b_64])
dist_32_sklearn = sklearn.metrics.pairwise.euclidean_distances([a_32], [b_32])

np.set_printoptions(precision=200)

print(dist_64_sklearn)
print(dist_32_sklearn)
I couldn't track down further the error.
I hope this can help.
—
You are receiving this because you are subscribed to this thread.
Reply to this email directly, view it on GitHub
<#9354 (comment)>,
or mute the thread
<https://github.com/notifications/unsubscribe-auth/AAEz65yy8Aq2FcsDAcWHT8qkkdXF_MfPks5sPLu_gaJpZM4OXbpZ>
.
|
|
I'd like to work on this if possible |
|
Go for it! |
|
So I think the problem lies around the fact that we are using |
|
@jnothman What do you think I should do then ? As mentioned in my comment above the problem is probably computing euclidean distance using |
|
So you're saying that dot is returning a less precise result than product-then-sum? |
|
No, what I'm trying to say is dot is returning more precise result than product-then-sum |
|
It is not clear what you are doing, partly because you are not posting a fully stand-alone snippet. Quickly looking at your last post the two things you are trying to compare |
|
Ok sorry my bad OUTPUT The first method is how it is computed by the euclidean distance function. |
|
Yes, I can replicate this. I see that doing the subtraction initially
allows the precision of the difference to be maintained. Doing the dot
product and then subtracting (or negating and adding), as we currently do,
loses this precision as the most significant figures are much larger than
the differences.
The current implementation is more memory efficient for a high number of
features. But I suppose euclidean distance becomes increasingly irrelevant
in high dimensions, so the memory is dominated by the number of output
values.
So I vote for adopting the more numerically stable implementation over the
d-asymptotically efficient implementation we currently have. An opinion,
@ogrisel? @agramfort?
|
|
And this is of course more of a concern since we recently allowed float32s
to be more commonplace across estimators.
|
|
So for this example product-then-sum works perfectly fine for np.float64, so a possible solution could be to convert the input to float64 then compute the result and return the result converted back to float32. I guess this would be more efficient, but not sure if this would work fine for some other example. |
|
converting to float64 won't be more efficient in memory usage than
subtraction.
|
|
Oh yeah you are right sorry about that, but I think using float64 and then doing product-then-sum would be more efficient computationally if not memory wise. |
|
And the reason for using product-then-sum was to have more computational efficiency and not memory efficiency. |
|
sure, but I don't believe there is any reason to assume that it is in fact
more computationally efficient except by way of not having to realise an
intermediate array. Assuming we limit absolute working memory (e.g. by
chunking), why would taking the dot product, doubling and subtracting norms
be much more efficient than subtracting and squaring?
Provide benchmarks?
|
|
Ok so I created a python script to compare the time taken by subtraction-then-squaring and conversion to float64 then product-then-sum and it turns out if we choose an X and Y as very big vectors then the 2 results are very different. Also @jnothman you were right subtraction-then-squaring is faster. |
|
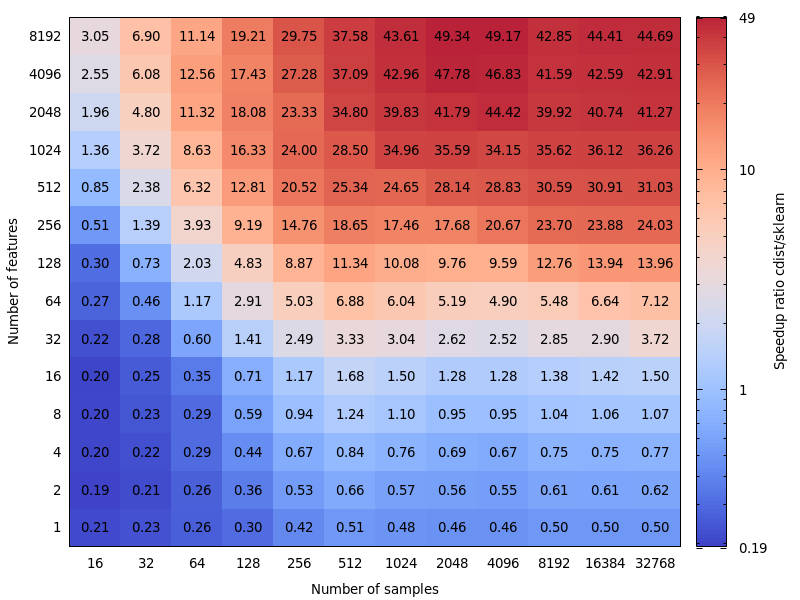
it's worth testing how it scales with the number of samples, not just the
number of features... taking norms may have the benefit of computing some
things once per sample, not once per pair of samples
…On 20 Oct 2017 2:39 am, "Osaid Rehman Nasir" ***@***.***> wrote:
Ok so I created a python script to compare the time taken by
subtraction-then-squaring and conversion to float64 then product-then-sum
and it turns out if we choose an X and Y as very big vectors then the 2
results are very different. Also @jnothman <https://github.com/jnothman>
you were right subtraction-then-squaring is faster.
Here's the script that I wrote, if there's any problem please let me know
import numpy as np
import scipy
from sklearn.metrics.pairwise import check_pairwise_arrays, row_norms
from sklearn.utils.extmath import safe_sparse_dot
from timeit import default_timer as timer

for i in range(9):
	X = np.random.rand(1,3 * (10**i)).astype(np.float32)
	Y = np.random.rand(1,3 * (10**i)).astype(np.float32)

	X, Y = check_pairwise_arrays(X, Y)
	XX = row_norms(X, squared=True)[:, np.newaxis]
	YY = row_norms(Y, squared=True)[np.newaxis, :]

	#Euclidean distance computed using product-then-sum
	distances = safe_sparse_dot(X, Y.T, dense_output=True)
	distances *= -2
	distances += XX
	distances += YY

	ans1 = np.sqrt(distances)

	start = timer()
	ans2 = np.sqrt(row_norms(X-Y, squared=True)[:, np.newaxis])
	end = timer()
	if ans1 != ans2:
		print(end-start)

		start = timer()
		X = X.astype(np.float64)
		Y = Y.astype(np.float64)
		X, Y = check_pairwise_arrays(X, Y)
		XX = row_norms(X, squared=True)[:, np.newaxis]
		YY = row_norms(Y, squared=True)[np.newaxis, :]
		distances = safe_sparse_dot(X, Y.T, dense_output=True)
		distances *= -2
		distances += XX
		distances += YY
		distances = np.sqrt(distances)
		end = timer()
		print(end-start)
		print('')
		if abs(ans2 - distances) > 1e-3:
			# np.set_printoptions(precision=200)
			print(ans2)
			print(np.sqrt(distances))

			print(X, Y)
			break
—
You are receiving this because you were mentioned.
Reply to this email directly, view it on GitHub
<#9354 (comment)>,
or mute the thread
<https://github.com/notifications/unsubscribe-auth/AAEz6z5o2Ao_7V5-Lflb4HosMrHCeOrVks5st209gaJpZM4OXbpZ>
.
|
|
anyway, would you like to submit a PR, @ragnerok? |
|
yeah sure, what do you want me to do ? |
|
provide a more stable implementation, also a test that would fail under the
current implementation, and ideally a benchmark that shows we do not lose
much from the change, in reasonable cases.
|
|
I wanted to ask if it is possible to find distance between each pair of rows with vectorisation. I cannot think about how to do it vectorised. |
|
You mean difference (not distance) between pairs of rows? Sure you can do that if you're working with numpy arrays. If you have arrays with shapes (n_samples1, n_features) and (n_samples2, n_features), you just need to reshape it to (n_samples1, 1, n_features) and (1, n_samples2, n_features) and do the subtraction: >>> X = np.random.randint(10, size=(10, 5))
>>> Y = np.random.randint(10, size=(11, 5))
X.reshape(-1, 1, X.shape[1]) - Y.reshape(1, -1, X.shape[1]) |
|
Yeah thanks that really helped 😄 |
|
After a quick discussion at the sprint we ended up on the following way:
|
|
(It's tempting to throw upcasting float32 into 0.20.3 also) |
This is very interesting. I wasn't actually expecting this result. I re-did your benchmark and found a very similar result. Except I would advocate for a lower decision boundary. My benchmark would suggest 8 features.
The cost of being wrong is not symmetric. Edit: This benchmark was for float64, but I also find that upcasting float32 matrices to float64 only barely add a few percent to the total time and doesn't change the conclusion. |
|
I noticed that the threshold depends on the machine you're running the benchmarks on. I suspect it may have to do with the AVX instructions. I realized the benchmarks I published were run on a machine which didn't have AVX2 instructions, only AVX. And on a machine which have AVX2, I got similar results to yours. But the question is not only about performance but also about precision and it's more likely to have precision issues when the dimension is small. Maybe 16 is a good compromise. What do you think ? |
|
In regards of this discussion, I'd say we need to benchmark the accuracy to take an informed decision. However, in regards of your PR, the accuracy shouldn't be an issue anymore. But at the cost of a slightly more expensive computation. Therefore the threshold should probably be decided by benchmarking your PR. |
|
Benchmarking accuracy is not that easy. Because the difficult cases will not be uniformly distributed. (this was using 0.19.1) The correct distance is 0.32. As you can see, the numeric instabilities tend to get worse with the number of features (unless your data is sparse). Here, the result has less than two digits of precision with FP64. |
|
#13410 does not fix this specific case. i.e float64 + high dimension. But we decided that for float64 + high dim, we keep it as it was, because the accuracy issues are very unlikely to happen and don't really apply to machine learning use cases. In your example, X[0] and X[1] have norms equal to 320000.32 and 320000 and their distance is 0.32, i.e. 1e-6 times their norm. In machine learning, the 16 significant digits (in float64) are not all relevant. |
I would be more moderate on this one. Reducing the dimensionality is a usual first step in ML. MDS can be used for that, and it makes a heavy use of the euclidean distance matrix. If someone want to have a look at improving the accuracy of the float64 case, there's a way to use two floats to represent the intermediate results. Although I think it starts to fall beyond the scope of scikit-learn. |
|
I was not clear. I'm not saying high dimensional data does not apply to machine learning. I'm saying that the kind of precision issues which happen in float64 involves points which distance is 6 orders of magnitude smaller than their norms. Having such a precision has no meaning in a realistic machine learning model |
I am not at all convinced that this is that generally true. In this example, we have lost 15 of 16 digits in precision. I'd agree if we would use half of the precision, but we don't have such a relationship. The loss from downcasting FP64 to FP32 may often be tolerable because of measurement precision. And consumer-grade GPUs are much faster with FP32 than with FP64, for example (in some cases, they allow FP32 data and FP64 accumulators now, though), and for neural networks inference, you may even see int8 now. But that doesn't hold everywhere. For example in k-means clustering, there is the assumption that clusters differ substantially in their means (and that we don't know the means beforehand), and hence we have a loss in precision here. If you have many clusters, some of their norms can be large compared to their separation. With increasing data sizes, we must assume that the distances to the nearest neighbor get smaller, and unless your norms are 0, they will eventually be smaller than the vector norms and cause problems. So this will likely become more severe with increasing data set sizes. The curse of dimensionality says that the largest and the smallest distances get more and more similar; so in order to compute the correct nearest neighbor ranking, we may need good precision in high-dimensional data. On the 20news data set, the smallest non-zero distance is around 0.02 (the norms are all 1). But that is just 10k instances, and fairly diverse contents. Now assume the data set was about near-duplicate detection instead... I would not be sure this "unlikely" happens in ML... of course it won't affect everybody though. |
|
When I say "In machine learning, the 16 significant digits (in float64) are not all relevant.", I'm not speaking of the computed distance, I'm speaking of the data X. For KMeans, first there's a way to overcome a large part of losses of precision. When you're looking for the closest center of an observation x, you don't need to add the norm of x to the distance calculation which avoids the catastrophic cancellation in most cases. |
|
The use of only "|b|^2-2ab" does not have catastrophic cancellation - but the same loss in precision in the digits that make the difference. The results are the same as if you added the norm of a to each distance afterwards; if the distances are much smaller than the norm of a, then you get a loss in precision that is avoidable by doing the computations the traditional way without BLAS hacks. K-means is an optimization problem. So such hacks may mean that sklearn finds only worse solutions than other tools. And as indicated before, this can also cause instabilities. In the worst case, this could cause sklearn kmeans to iterate through the same states until Depending on the application, the difference between As mentioned, the mean may have a physical meaning that you don't want to lose. If you have data with temperatures in Kelvin, you don't want to 0:1 scale them or center them; that would ruin your ratio scale. Now if you want to compare, for example, time series of the temperature of some steel product as it cools down, and figure out if the cool down process affects the reliability of your steel product. You may be having temperatures of over 700 K, and the time series may have hundreds of data points if you want to analyze the cooldown process. Even with just 5 digits of input precision (0.01K) with the length of the time series the numeric problem can occur. You may again end up with only 1-2 digits in the result. I don't think you can just rule out that precision ever matters in ML if you have this catastrophic kind of effect. Its a different if you could guarantee to always get, say 10 of 16 digits in precision. Here you can't do that, you may have 0 digits right in the worst case (that is why it's catastrophic). |
The raw values from the real world rarely have that kind of accuracy, that's right. But ML isn't limited to that kind of input. One might want to apply ML to mathematical problems, like applying MDS on the graph of a rubik's cube-like puzzle or clustering the successful strategies found by your swarm of RL agents playing pacman. I'm actually wondering why we're still discussing this. I guess we all agree that scikit-learn should try its best in the trade-off accuracy vs. computation time. And whoever isn't happy with the current state should submit a pull request. |
There is a loss of precision, but it can't cause a catastrophic cancellation (at least when a and b are close), and you can show that the relative error on the distance (which is not a distance) stays small. Besides, KMeans is not a convex optimization problem, so even if you let it run with tol=0 until convergence, you end up in a local minima which can be far off the global minima (even with kmeans++ initialization). So I'd rather run kmeans many times with different init and a reasonably small number of iterations. You'll have better chance to end up in a better local minima. Then you can rerun the best one until convergence. |
|
The relative error compared to the real distance can be arbitrary large, and hence cause wrong nearest neighbors. Consider the case where |a|²=|b|²=1, for example on tf-idf. Assume that the vectors are very close. Then ab is also close to 1, and at this point you already lost much of your precision. Yes, kmeans is not convex. But then you will want to at least find a local optimum, and not get stuck (or even oscillate because the resulting errors behave erratically) because your precision is too low. So you at least get a chance to find the global one in well-behaved cases and with multiple attempts. |
|
I appreciate this discussion, but what we really need is a solution that is no worse than what we were doing before we stopped upcasting things to float64. In that sense, @Celelibi's upcasting solution was sufficient. Using the exact solution in low dimensions is an added improvement on what we used to do. Regarding a future version, do you feel any more confidence to efficiently detect when we might consider the exact computation in high dimensions? |
|
I've run a benchmark to evaluate the average accuracy of the float64 case with random numbers. I compare 3 algorithms: On the following gif, there's one image per number of feature (between 1 and 200). On each image, each dot represent the relative error of the squared euclidean distance between one of the 10000 pair of vectors of
Note that the graphs were cut at 6 ULP for readability. It shows the average case, not the worse case. The error of the expanded formula can grow pretty large. My analysis of this result is that on average, the relative error of the expanded formula can be very large with few features, but quickly become similar to that of the difference and numpy sum. The threshold being between 5 and 10 features. I'm also currently trying to find an upper bound for the error of the expanded formula as well as pathological examples. |
|
I think @kno10's concern is that we are often interested in cases where
points are not randomly distributed, but are near each other or have unit
norm.
|
|
Indeed, but I needed to be convinced that in practice, it's not complete BS. ^^ To complete the comment above: the relative error of the formula >>> a, b = (0xfffffec4d6282+1) * 2.0**(511-52), 0xfffffec4d6282 * 2.0**(511-52)
>>> a, b
(6.703903473040778e+153, 6.7039034730407766e+153)
>>> exactdiff = (a-b)**2
>>> exactdiff
2.2158278651204453e+276
>>> computeddiff = a**2 + b**2 - 2*a*b
>>> computeddiff
-9.9792015476736e+291
>>> abs((computeddiff - exactdiff) / exactdiff)
4503599627370497.0
>>> bin(int(abs((computeddiff - exactdiff) / exactdiff)))
'0b10000000000000000000000000000000000000000000000000001'Flipping the sign of the result would actually make it closer to the truth. This is the most dramatic example I could find, but actually changing the exponent in the values of >>> a, b = (0xfffffec4d6282+1) * 2.0**(-52), 0xfffffec4d6282 * 2.0**(-52)
>>> a, b
(0.9999999266202912, 0.999999926620291)
>>> exactdiff = (a-b)**2
>>> computeddiff = a**2 + b**2 - 2*a*b
>>> abs((computeddiff - exactdiff) / exactdiff)
4503599627370497.0 |
|
I think a histogram plot in ULPs would make more sense than above animation with the within-ULP error distribution. So 0 ULP error and 1 ULP error are "as good as it gets". 2 ULP is likely unavoidable because of the sqrt. Any larger errors are worth investigating I assume. Using Consider input data of the type |
I'm not sure I see how you would have represented it. There would be one histogram per number of feature and per algorithm. There's not much I can do beside a 3D plot or an animation.
I'm not sure what you mean by unstable in this context. The exact value should be computed with whatever it takes to make it exact.
If I understand your idea correctly, you would rather compare the absolute error to the magnitude of the input data. Using the vector norms as an aggregated measure of the magnitude of the inputs. Whereas the standard relative error compare it to the magnitude of the exact result. I think with this metric you try to capture how much faulty is an algorithm. But it actually doesn't seem particularly useful for a few reasons.
The dot-based algorithm would have a relative error of |
|
If we are still concerned about the precision of euclidean_distances with float64, probably better to summarize this discussion in a new issue as there are 100 comments here. |
Description
I noticed that sklearn.metrics.pairwise.pairwise_distances function agrees with np.linalg.norm when using np.float64 arrays, but disagrees when using np.float32 arrays. See the code snippet below.
Steps/Code to Reproduce
Expected Results
I expect that the results from sklearn.metrics.pairwise.pairwise_distances would agree with np.linalg.norm for both 64-bit and 32-bit. In other words, I expect the following output:
Actual Results
The code snippet above produces the following output for me:
Versions
The text was updated successfully, but these errors were encountered: