This is the final project to complete study at Bogor Agricultural University, this project is divided into 2 parts, namely web-based monitoring and tools with a microcontroller. Basically the concept of making this tool is to measure the value of the NTU (Nephelometric Turbidity Unit) in raw water. A microcontroller mounted on a standard water tank will send the results of measurement values that have been calibrated by the Kalman filter method. The data will be sent to a web-based monitoring system which is divided into 2 methods, namely using realtime monitoring charts and resporting methods that can be downloaded directly. This tool is very effective in increasing efficiency and effectiveness in measuring NTU levels of water
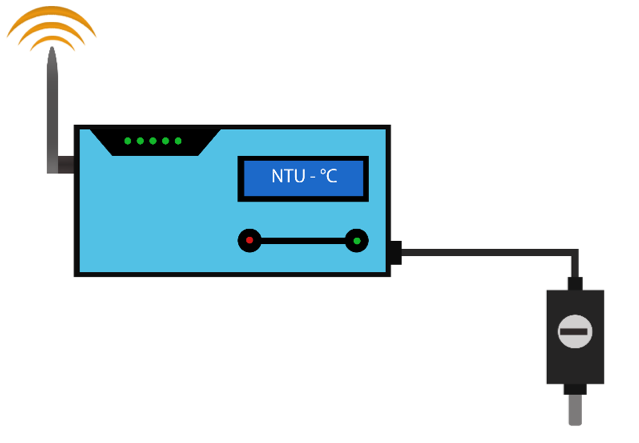
The main tool for this turbidity monitoring system is installed in the chemical laboratory of PDAM Tirta Bhagasasi Rawa Lumbu branch, turbidity sensor is installed in IPA 40 (Water Treatment Installation) with a capacity of 40 liters / second by using a 30 meter long UTP (Unshielded Twisted Pair) cable for data transmission, and computers in the IT room (Information Technology) Rawa Lumbu which is used as a server computer for web turbidity. The transmission of data on the main device to the server computer using wireless media so that it can facilitate the admin in monitoring
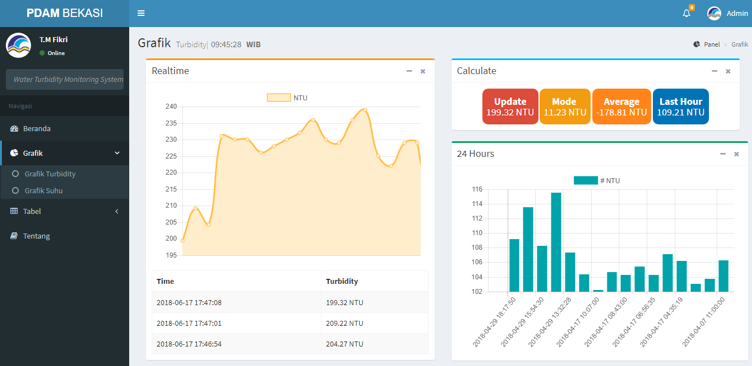
Temperature graph page with identity functions to display information in the form of graphs and temperature tables in realtime. This page has no input interactions so it can only be used as an output for temperature monitoring. The process flow on the temperature graph page is the admin can access the page then the system will display data in the form of graphs and tables.
to capture graph monitoring data in realtime using the following queries
•$data1 = mysqli_query($koneksi, "select suhu from tbl_suhu_realtime  where ntu>=0 order by waktu desc limit 1");
•$data2 = mysqli_query($koneksi, "select suhu from tbl_suhu_realtime where ntu>=0 order by waktu desc limit 20");
•$data3 = 'select (select count(*) from tbl_suhu) as count, (select count (*) from tbl_suhu where ntu>=120)  as counts,(select count(*) from tbl_suhu where status=0)  as counta ';
•$data4 = mysqli_query($koneksi, "select  waktu from tbl_suhu order by waktu desc limit 24");
This command is used to send input data from sensors in analog form that has been converted with a Kalman filter. the results of the conversion are stored and transmitted in digital data with stable accuracy
lcd.print(celcius);
  client.println("GET /pdam/include/insertsuhu.php?celcius="+(String(celcius))+ "&adc="+ (String (z))+ "&status="+ (String (keterangan)));
integration with ethernet
byte mac[] ={ 0xDE,0xAD,0xBE,0xEF,0xFE,0xED};
char server [] = "192.168.1.11";
IPAddress ip (192,168,1,99);
code to read analog values on the sensor
void Data_NTU (){

  for(i=0;i<1;i++) {

 suhu.requestTemperatures();
 celcius=suhu.getTempCByIndex(0);

  ADC_NTU[i] = analogRead(A0);
  ADC_NTU[i] >= z; {
  z = ADC_NTU[i];
      }
    }
You can find the value of accuracy with this formula
Δx =  Xa - Xb
= 26.20 – 25-99
= 0.21

(1-(∆x/Xa))×100%
= (1-(0.21/26.20))×100%
= (1 – 0.008) ×100%
= 0.992 ×100%
= 99.20 %