Influence of state subsidies and local conditions on the development of public EV charging infrastructure within Europe.
| Index: Home |
![]()
This repository contains the Master's Thesis of my 'Information Systems' M.Sc. degree programme. As part of that thesis, I built a framework in 'R' that enables the automatic categorisation of any desired longitude/latitude locations based on their individual surrounding features in OpenStreetMap. In the thesis, the desired locations are charging stations for electric vehicles in Germany, France and Italy as provided by Open Charge Map. The goal was to categorise these charging stations and compare them with the respective country's subsidy programme.
In other words: investigate which surrounding locality features exist for each charging station in the OpenStreetMap database, make an assumption towards the location category (e.g. in residential areas, rest stop along motorways, etc.), investigate how each location category evolves over the years and compare that evolution with the timeframe of state subsidy programmes. This enables the drawing of conclusions regarding which category of charging stations are impacted by state subsidies and which categories evolve independently. In this process it is not necessary to know which or even how many location categories exist before running the framework. This aspect relies on a Latent Dirichlet Allocation topic modelling approach. This framework is universally applicable and does not depend on the kind of locations (e.g. charging stations) you want to investigate. However, there was no time to build a UI, so it will require manual adjustments in the code. To simplify that, I provided the thesis itself in this repository for an exhaustive explanation and will try to explain the procedure in general below.
The framework relies on OpenStreetMap exports provided by Geofabrik for the most comprehensive database of local features. Those exports are preferred, because they are provided in a uniform, consistent and well-structured manner and are pre-filtered to reduce noice. The datasets for Germany, France and Italy are downloaded automatically in the code and go through various cleaning and preparation stages explained in the following.
This stage is based on the feature catalogue which, in turn, is based on this documentation (version 7 from 2019-05-21). This catalogue contains all possible local features included in the Geofabrik exports and further includes a group value for each possible local feature, which defaults to 0. If a feature is undesired, it is specified as group: NA and subsequently dropped from the dataset. This can be due to the following reasons:
| NO_TARGET | feature unlikely to be target of car ride or duration of stay/use doesn't facilitate a charging event. | e.g. 'public_telephone', 'misc_bench' |
| NO_IMPLICATION | feature doesn't provide any useful information on the location. (e.g. demographic, economics, etc.) | e.g. 'places_region', 'natural_tree' |
| NO_ACCESS | feature generally not accessible to the public or does not provide (public) parking. | e.g. 'railways_rail', 'landuse_military' |
| TEMPORARY | feature is likely to be only temporary. | e.g. 'tourism_archaeological', 'building_construction' |
NOTE: Other values for group can be possible for localities that are semantic duplicates like 'building_public', 'public_public_building', 'building_civic', 'building_government'.
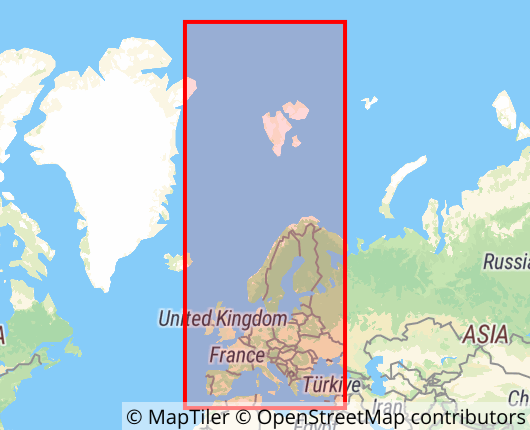 By default, all geometries are unprojected and formatted in the 'World Geodetic System from 1984'. For easier processing, the geometries are converted to a projected Coordinate Reference System. As all considered countries are in mainland Europe, the decision fell on the 'European Terrestrial Reference System from 1989', which specifies metres as the base unit simplifying future processing. Depending on the countries of your choosing, a different CRS might be necessary, which can be found in the EPSG Geodetic Parameter Database.
For more information about the difference between projected and unprojected, please refer to this article.
This is an optional stage in the preparation procedure and can be enabled if the amount of geometries becomes unbearably large or memory limits are reached.
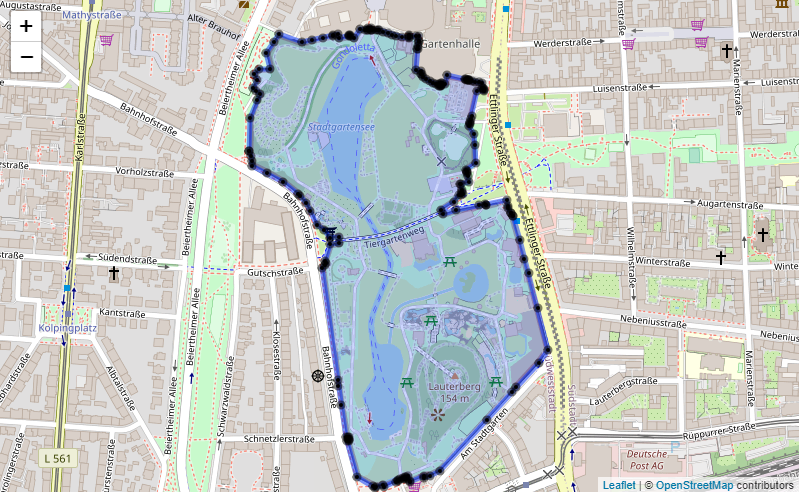
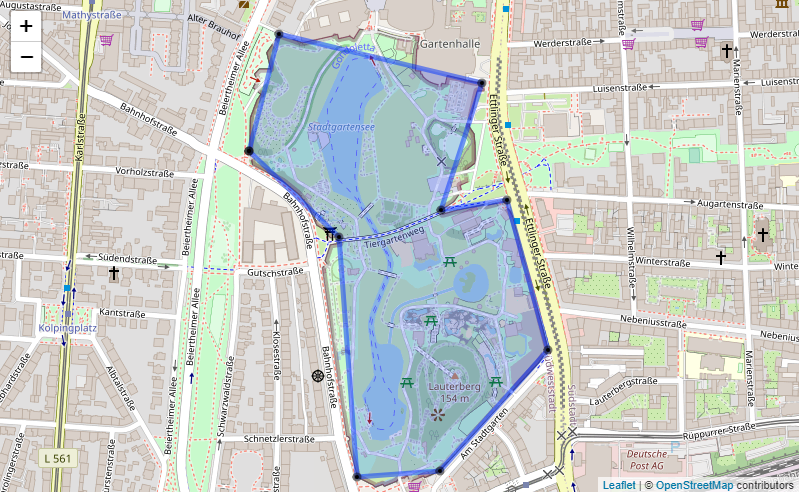 Depending on the radius around the desired longitude/latitude locations in which local features are used for the categorisation, the amount of geometries can be overwhelming and their 'resolution' overly detailed. Therefore, the geometric shape can be simplified by reducing the number of vertices defining the polygon with a certain distance threshold. The images provide an example of this simplification in action for the 'Zoologische Stadtgarten' in Karlsruhe, Germany with a distance threshold of 75 metres.
This stage relies on the semantic grouping, which was already hinted at in the first preparation stage. Some locality features are semantically similar and since OpenStreetMap is a community project, different contributors might have different ways of filing localities, leading to one locality feature being represented by multiple instances with different specifications. For example, a city's town hall can be either 'building_public', 'public_public_building', 'building_civic' or 'building_government'. Therefore, semantic groups are defined in the feature catalogue to remove (semantic) duplicates.

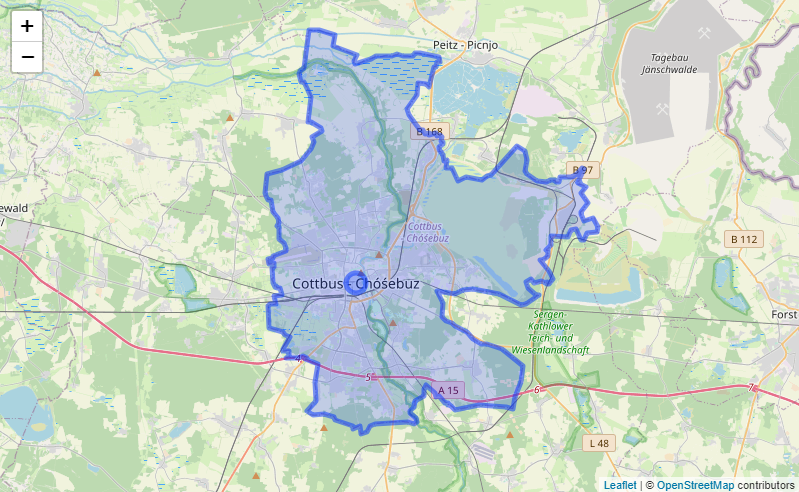 Another aspect is that OpenStreetMap generates label points for polygon geometries at which the title is printed on the map. This is visible on the example of the city of Cottbus, Germany in the images to the side. Both the polygon shape and the label point are filed as a city in the OpenStreetMap database, which leads the framework to assuming that a charging station in Cottbus is in the vicinity of two cities instead of one. Therefore, all point labels that intersect with a polygon geometry of the same class are considered to be label points and dropped from the dataset.
The thesis aims to categorise charging stations which are provided by Open Charge Map in a longitude and latitude format. The first preparation stage is to generate valid SF point geometries from the longitude/latitude information, to ensure the same format as the locality feature geometries above. This includes assigning the same Coordinate Reference System, the 'European Terrestrial Reference System from 1989' for mainland Europe.
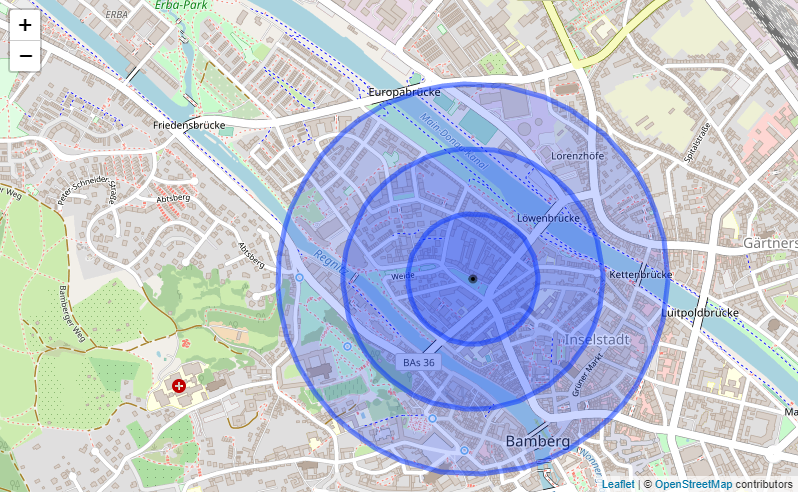 In terms of computation time, the most efficient way of retrieving all locality features in the vicinity of each charging station was found to be the creation of 'buffer zones'. These buffer zones are simply circular polygon geometries with a specified radius around the respective charging station. The image to the side shows this at the example of a charging station in Bamberg, Germany. To investigate the effect different radii have on the framework outcome, the entire process was conducted with three different radii around the charging stations: 200, 400 and 600 m, respectively.
For a comprehensive explanation of how the categorisation is conducted, please refer to the thesis itself. Basically, for each charging station, the framework generates a list of which locality features from the OpenStreetMap database intersect with the respective 'buffer zone'. It then takes a LDA-based topic modelling approach to generates abstract topics (categories) based on correlations between locality features. The framework does that iteratively for 2-25 categories and provides a log-likelihood graph to enable the manual selection of the most appropriate number of categories. Based on the list of locality features per category, the user can then assign a semantic interpretation manually.
 For each country, the framework provides an exhaustive table of which categories have been generated along with their weighted importance as well as which locality features are part of each category, again along with the individual weighted importance. This is done so that the effect of individual features on each category as a whole and the prevalence of each category compared to others can be estimated.
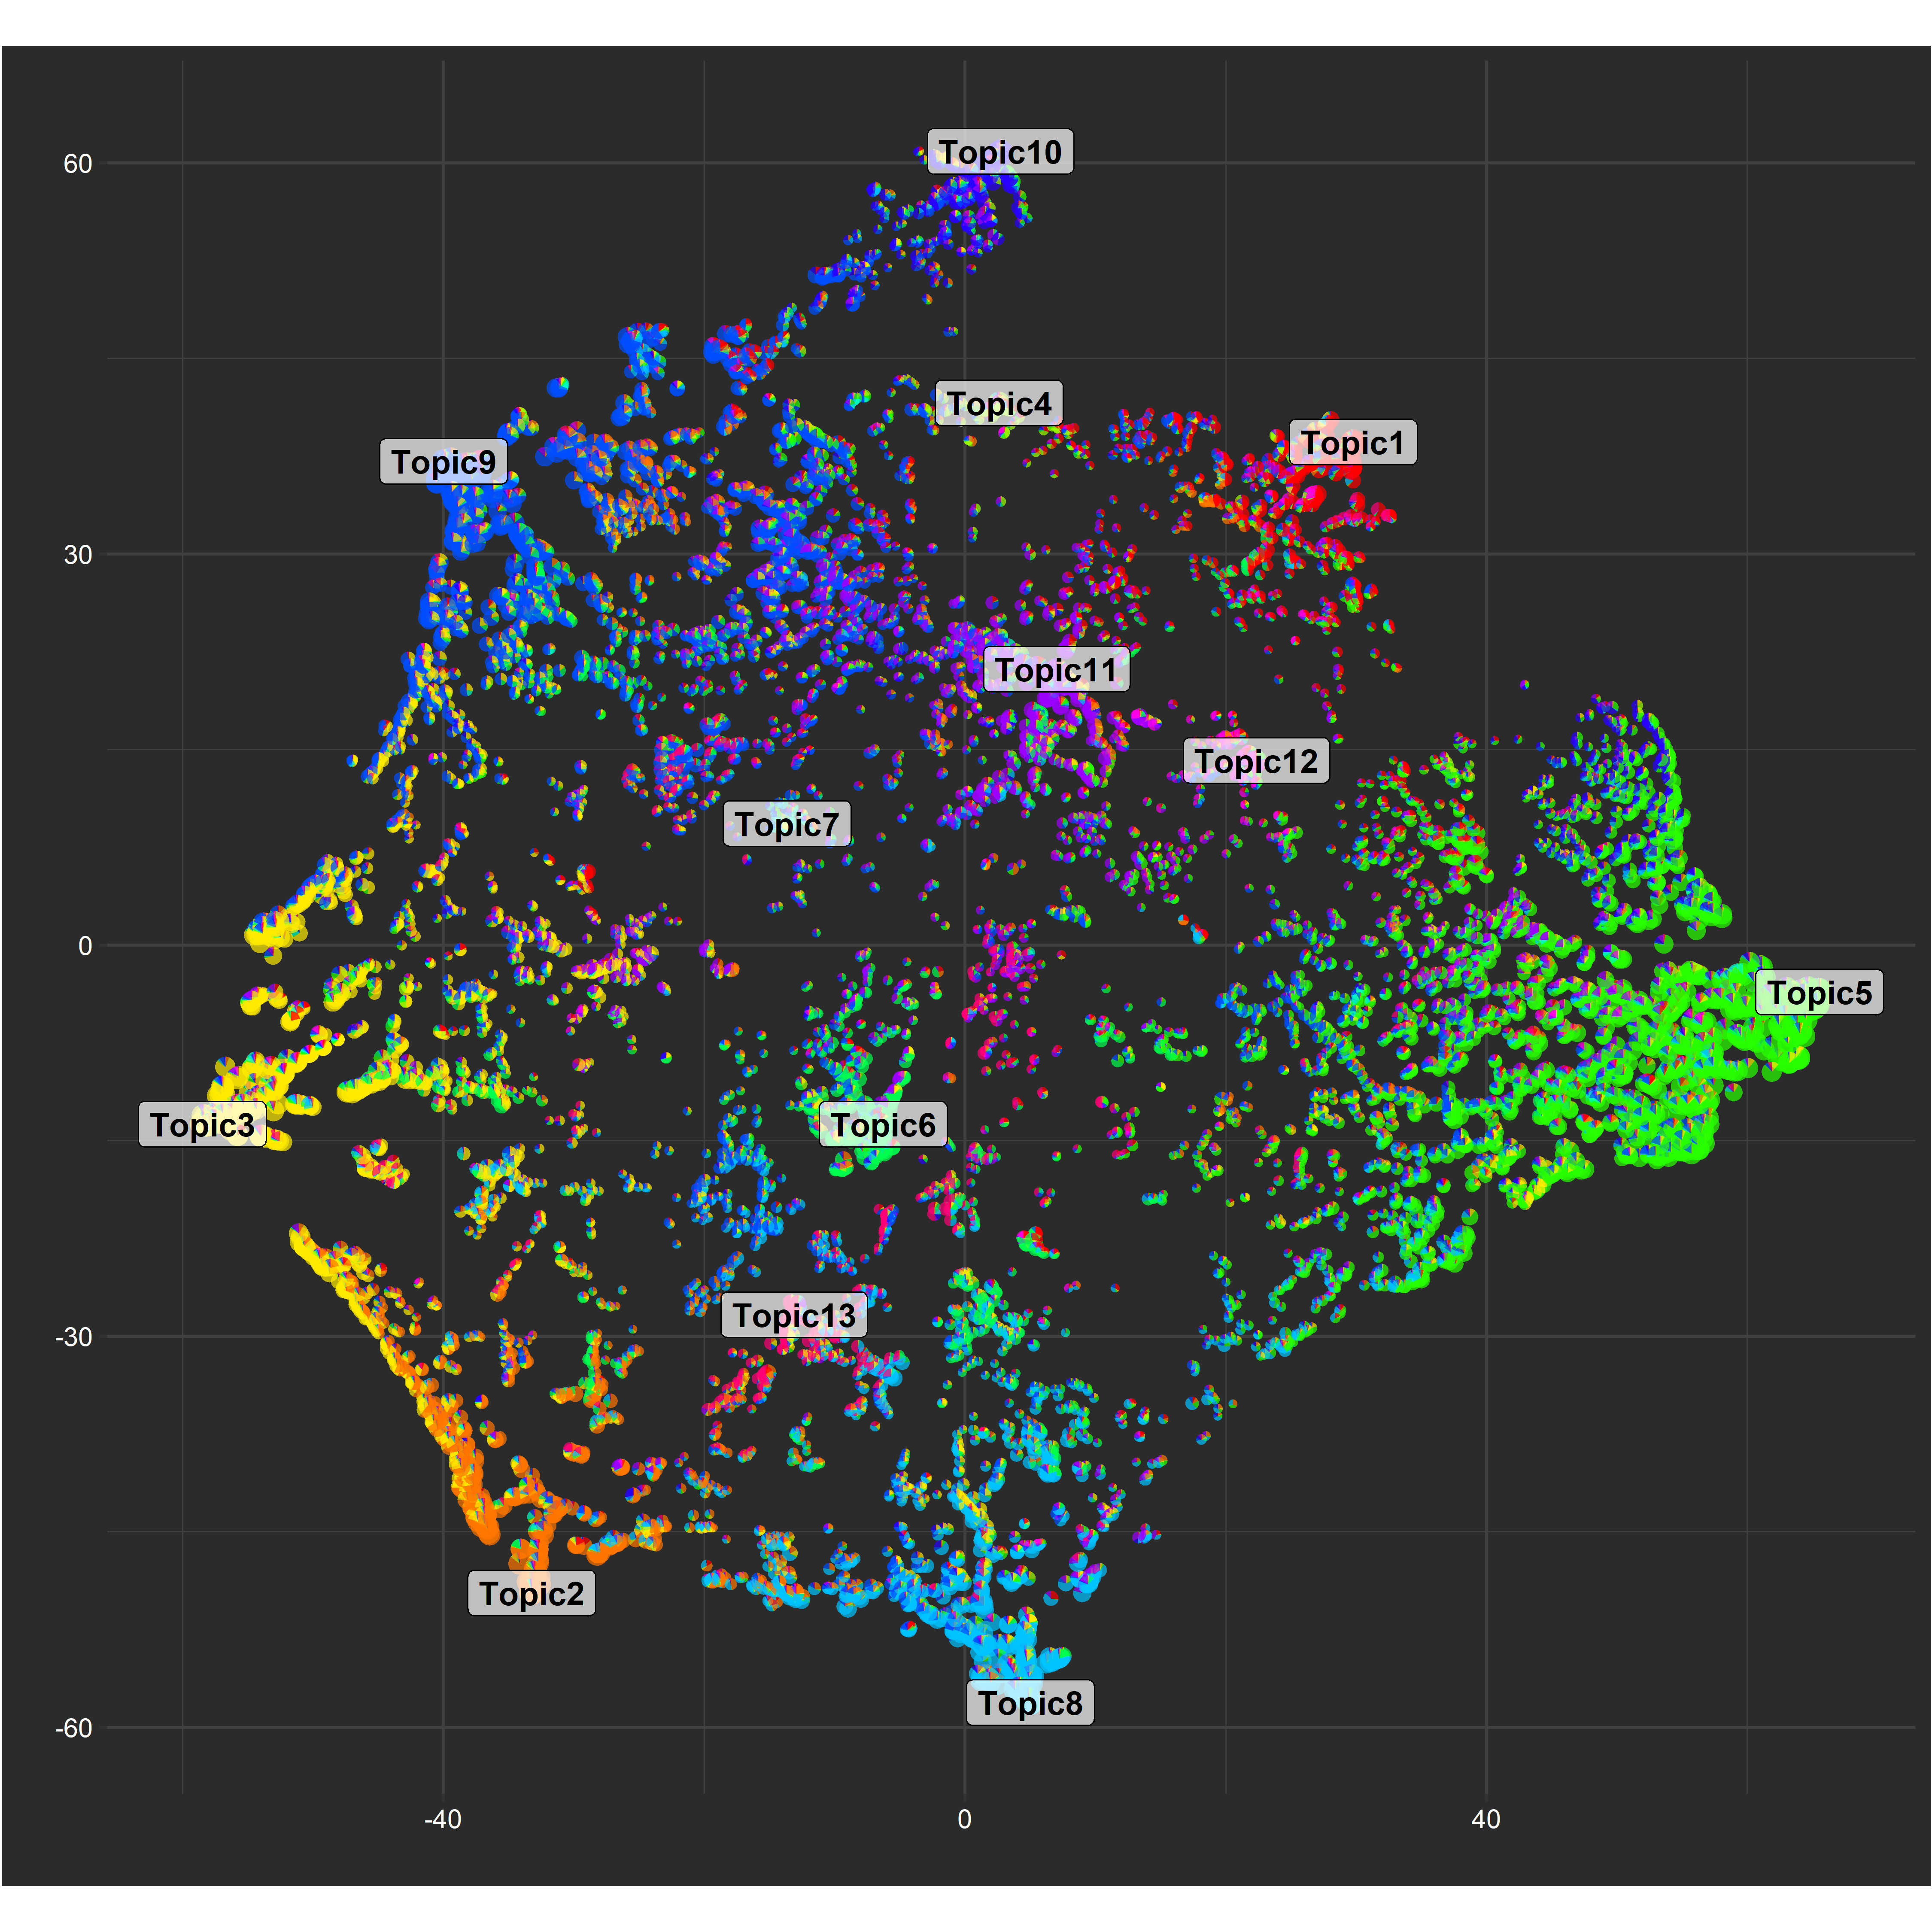
Furthermore, based on this blog post t-SNE scatterpie charts are compiled to provide a more intuitive and accessible representation of the exhaustive table above. In this chart, the relations between categories as well as the number of locations per category can be estimated.
This was a very rough summary of what the created R framework does. You will notice that there are additional charts and graphs in the thesis, but these are mostly specific to the thesis' use case of categorising charging stations. This was the first time I properly worked with R, but I am quite pleased with the outcome. Naturally, there were additional plans to make the framework even more universally applicable with a possible UI and other measures of reducing the necessary manual input. If there is interest in this work in the future, then I might come back and continue work on it, but for now, this is a completed project. If there are any questions regarding functionality, licence or else, please don't hesitate to contact me via the email in my Github profile. Using the email stated on the thesis will no longer work, I'm afraid.