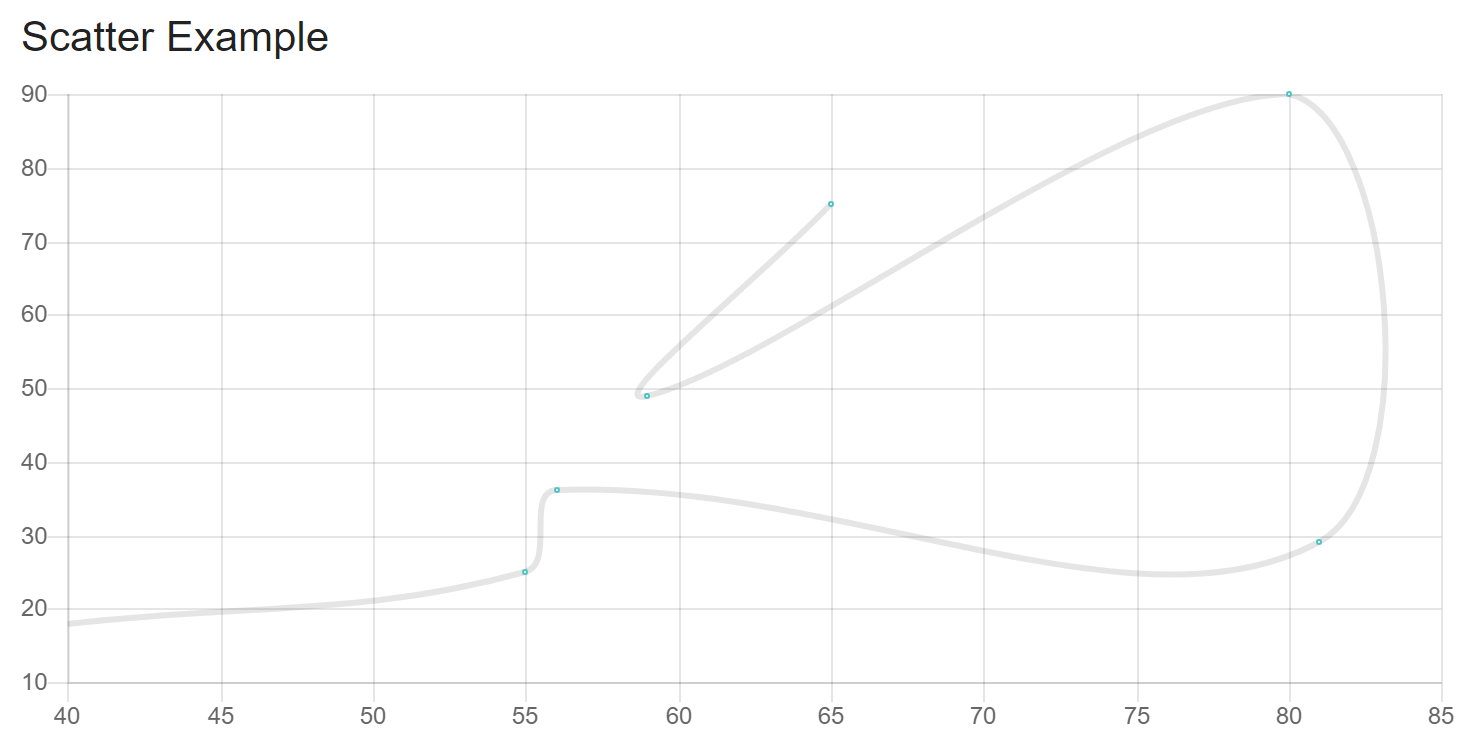
I'm trying to have a scatter {x,y} graph with a line connecting the points but i couldn't make the line show like the example in the website (as showed bellow) .
Here is my code:
<Scatter data={this.chartData} options={this.chartOptions} />
    chartData = {
        datasets:[
            {
                label: "S11 Polar Graph",
                fill: false,
                backgroundColor: this.props.color,
                pointBorderColor: this.props.color,
                pointBackgroundColor: '#ffffff',
                pointBorderWidth: 1,
                pointHoverRadius: 5,
                pointRadius: 3,
                pointHitRadius: 10,
                data: this.state.data
            }
        ]
    }
chartOptions = {
maintainAspectRatio: false,
showLine: true,
scales: {
xAxes: [{
display: true,
labelString: "Frequency (Hz)"
}],
yAxes: [{
display: true,
labelString: "Frequency (Hz)"
}]
}
}
I'm trying to have a scatter {x,y} graph with a line connecting the points but i couldn't make the line show like the example in the website (as showed bellow) .
Here is my code:
<Scatter data={this.chartData} options={this.chartOptions} />