Golden Cheetah (GC) is an open-source data analysis tool primarily written in C++ with Qt for cyclists and triathletes with support for training as well.
This wrapper program is enabling you to build more advance python charts and debug them.
Within GC you can create python charts for more information on that see GC wiki page: UG_Special Topics_Working with Python
This project is created based on GC version 3.6 Note: last update xdata series are supported this need latest snapshot build for performance reasons: Snapshot Builds
Any remarks or questions post them on the GC User Forum
I assume you have GC installed and configured python in GC. Your python is at least configured as described in GC wiki page: UG_Special Topics_Working with Python
For now this is only tested with pycharm and on windows 10.
For this project I use PyCharm for download see PyCharm. Once you have cloned or downloaded this project and opened it in pycharm you should configure you python interpreter. For easy use and interoperability use the same python interpreter that is configured in GC
Depending on the amount of data these extract can take up to an few minutes. Both step need to executed:
In example extraction directory there is an single_extract script copy this script into an python chart in GC and update the store_location = 'D:/git-repos/GoldenCheetah_Python_Chart_Wrapper/GC_DATA/'.
Select and activity you want to use it will generate the data to the configured location.
Tip also select and interval this is also used in some of the charts.
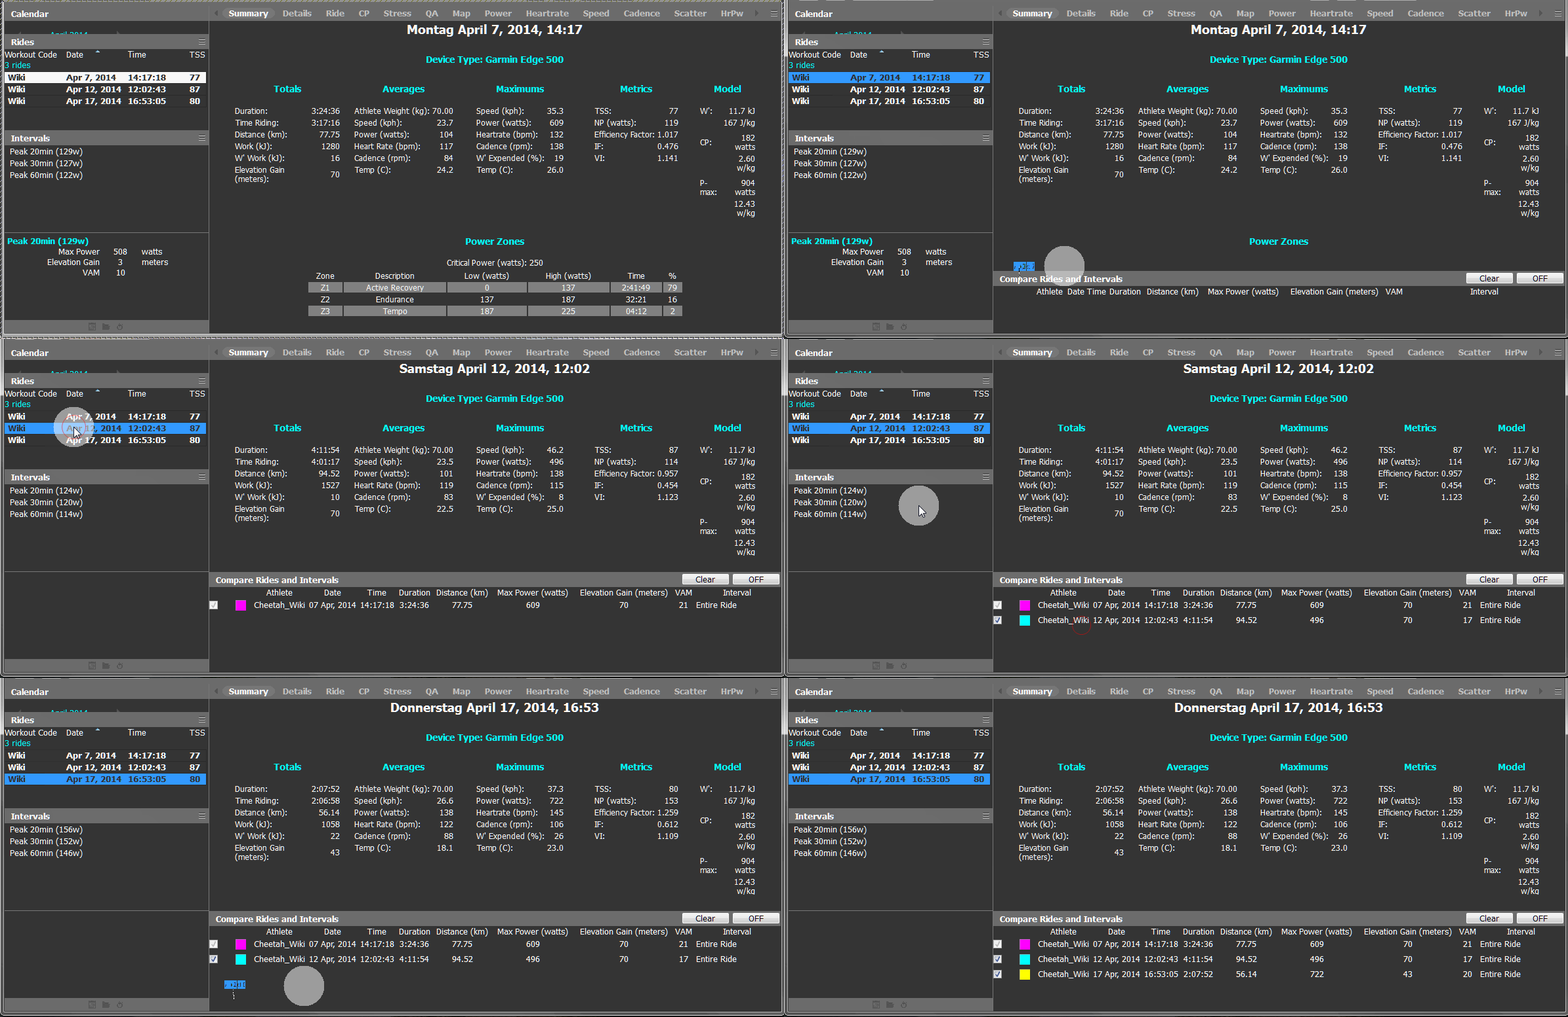
For this you need to switch in GC to the Trends view select 2 or more 'Date range'.
How can be found in UG_Compare Pane_General.
 Create an python chart in the trends view in GC and copy the content of trends_extract_with_compare into it.
Tip Don't forget to turn the compare on.
After you have followed the two steps you should be able to execute the charts
Sometimes you need special data you can implement this in the GC_wrapper functions. A small example is given below to get specific season metrics:
def seasonPmc(all=False, metric="TSS"):  # to get PMC data for any given metric
    if metric == "TSS" or metric == "BikeStress":
        return season_pmc_data.all_TSS

    # Rest Not implemented yet
return NoneSimple copy paste the content of the python file and remove the following line:
from GC_Wrapper import GC_wrapper as GC
And don't forget to share your charts in the cloud db function of GC so other also benefit from it :)
- Create an popup what and is extracted where (give the possibility to cancel)
