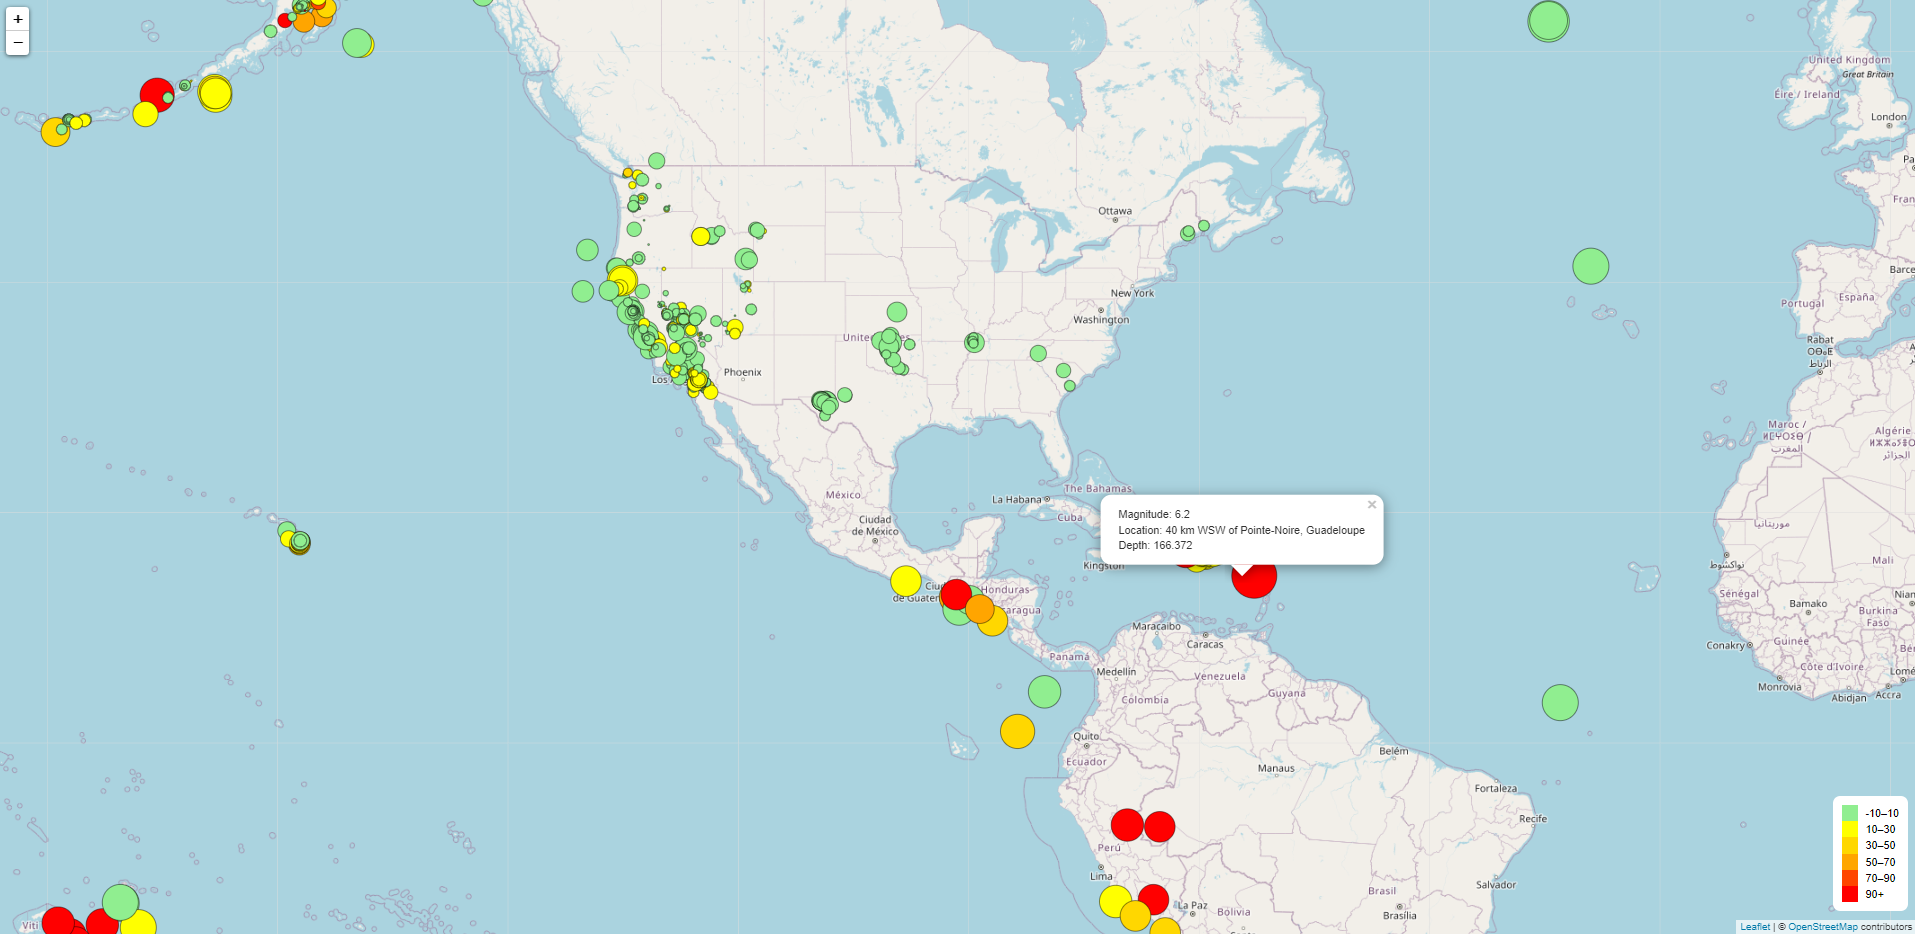
In this project, I was tasked with building an interactive dashboard using Leaflet library to visualize earthquake data provided by the United States Geological Survey (USGS). My job was to create a map that plots all the earthquakes based on their longitude and latitude. The data markers should reflect the magnitude of the earthquake by their size and the depth of the earthquake by color. Additionally, I had to include popups that provide additional information about the earthquake when its associated marker is clicked. Also, creating a legend that will provide context for the map data is part of the task.
- Basic knowledge of JavaScript
- Familiarity with D3.js and Leaflet libraries
- Understanding of geoJSON and APIs
- Use USGS GeoJSON Feed data to visualize earthquakes on a map
- Represent magnitude of earthquakes by size and depth by color on the data markers
- Add popups with additional information about earthquakes when markers are clicked
- Create a legend to provide context for the map data
- Deploy the final project on a web hosting service like GitHub Pages