- General Information
- Matlab Implementation
- Python Implementation
- R Implementation
- Parameters
- Matlab Requirements
- Numerical Differences Between Implementations
- Status
- References
- Citations
- Contact
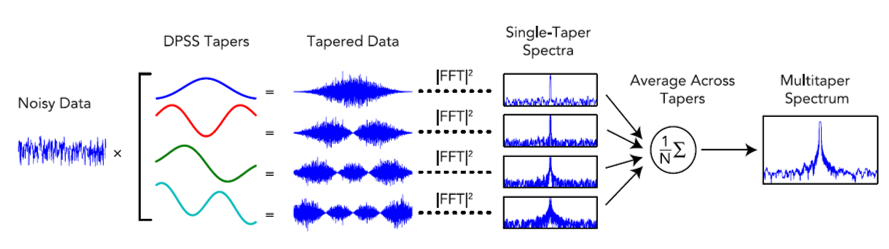
This repository contains Matlab, Python, and R implementations of the multitaper spectrogram analysis described in the paper "Sleep Neurophysiological Dynamics Through the Lens of Multitaper Spectral Analysis"1. Multitaper spectral estimation was developed in the early 1980s by David Thomson2 and has been shown to have superior statistical properties compared with single-taper spectral estimates3,4. The multitaper method works by averaging together multiple independent spectra estimated from a single segment of data. The innovation of the multitaper method is that, instead of using a single-taper function to compute the spectrum, it uses multiple taper functions called discrete prolate spheroidal sequences (DPSS). Because DPSS tapers are uncorrelated with each other, they can be averaged together as if they were independent trials of the same condition, producing a spectrum with reduced variance compared to periodogram and single-taper estimation.
Find videos describing the theory of spectral estimation and demonstrating how multitaper spectral estimation works at http://sleepeeg.org/multitaper on the Prerau Lab website.
Prerau MJ, Bianchi MT, Brown RE, Ellenbogen JM, Patrick PL. Sleep Neurophysiological Dynamics Through the Lens of Multitaper Spectral Analysis. Physiology (Bethesda). 2017 Jan;32(1):60-92. Review. PubMed PMID: 27927806.
- multitaper_spectrogram.m: baseline parallelized implementation in Matlab
- multitaper_spectrogram_mex.m: optimized implementation in C called from Matlab. Data precision is reduced from double to single for major speed improvements.
- See the matlab implementation folder for usage information and other details of the Matlab implementation
- multitaper_spectrogram_python.py: baseline implementation in Python with option for multiprocessing
- requirements.txt: contains names and versions of non-standard library Python packages required to run multitaper_spectrogram_python.py
- See the python implementation folder for usage information and other details of the Matlab implementation
- multitaper_spectrogram_R.R: baseline implementation in R with option for multiprocessing
- See the R implementation folder for usage information and other details of the Matlab implementation
The spectral parameters used in all implementations of the multitaper spectrogram are described here.
- data: 1-dimensional time series data
- Fs: Frequency at which the data was sampled in Hz
- frequency_range: [min frequency, max frequency] Range of frequencies (Hz) across which to compute the spectrum. The default for all implementations is [0, fs/2].
- taper_params: [time-halfbandwidth product, number of tapers] The time-half bandwidth product (TW) can be computed as N*(BW/2) where N is the length of the window (seconds) and BW is the bandwidth of the main lobe. The bandwidth of the main lobe is also called the frequency resolution because it dictates the minimum difference in frequency that can be detected. "Number of tapers" is the number of DPSS tapers to be used to compute the spectrum. The optimal number of tapers is 2*(TW)-1. The default for all implementations is [5, 9].
- window_params: [window size (seconds), step size (seconds)] These parameters dictate the temporal resolution of the analysis. The multitaper spectrum is computed for a single window of data, then the window moves based on step size and the spectrum will be computed again on the next window until the whole data array has been covered. The default for all implementations is [5, 1].
- min_nfft: Multitaper spectrum computation relies on the Fourier Transform to transform the data from the time domain to the frequency domain. The Fast Fourier Transform (FFT) is an very computationally efficient algorithm to compute the Fourier Transform, and it works most efficiently when the number of data points in the given time series is a power of 2. Therefore, we want to pad the data with 0s to make it reach the closest power of 2. This implementation pads with zeros to the nearest power of 2 automatically, but if a specific power of 2 above the closest power fo 2 is desired, use this parameter. The default for all implementations is 0.
- weighting: The DPSS tapers can be weighted differently, and we have included 2 weighting method options - 'eigen' and 'adaptive' - along with the uniformly weighted option 'unity' which is the default for all implementations. Eigenvalue weighting weights the contribution of each taper to the spectrum by it's eigenvalue (frequency concentration). In most cases this makes little difference because most taper's eigenvalues are very close to one anyway. The adaptive weighting method weights the tapers in such a way as to reduce the broadband leakage of non-white ('colored') noise. This method is adapted from pages 368-370 of Percival and Walden's "Spectral Analysis for Physical Applications: Multitaper and Conventional Univariate Techniques"5. In practice, the adaptive method does not change the results much at all but is provided here for the sake of completeness.
- detrend_opt: Each window of data can be detrended to remove very low frequency oscillation artifacts that can come from a variety of sources. In "linear" detrending, a linear model is fit to the window then subtracted out, while in "constant" detrending the data is set to be zero mean. The default for all implementations is "linear", and the options are "linear", "constant", and "off".
- In data point comparisons Matlab and Python implementation results tend to agree on average with precision on the order of at most 10^-13 with SD of at most 10^-10.
- In data point comparisons R and Python implementation results tend to agree on average with precision on the order of at most 10^-11 with SD of at most 10^-9.
For the toolbox we currently require:
- Signal Processing Toolbox
- Image Processing Toolbox
- Statistics and Machine Learning Toolbox
For parallel (optional)
- Parallel Computing Toolbox
- MATLAB Parallel Server
The code contained in this repository for multitaper spectral analysis is companion to the paper:
"Sleep Neurophysiological Dynamics Through the Lens of Multitaper Spectral Analysis"
Michael J. Prerau, Ritchie E. Brown, Matt T. Bianchi, Jeffrey M. Ellenbogen, Patrick L. Purdon
December 7, 2016 : 60-92
DOI: 10.1152/physiol.00062.2015
which should be cited for academic use of this code.
All implementations are complete and functional but may receive updates occasionally
- Prerau MJ, Bianchi MT, Brown RE, Ellenbogen JM, Patrick PL. Sleep Neurophysiological Dynamics Through the Lens of Multitaper Spectral Analysis. Physiology (Bethesda). 2017 Jan;32(1):60-92. Review. PubMed PMID: 27927806.
- Thomson DJ. Spectrum estimation and harmonic analysis. Proc IEEE 70: 1055–1096, 1982.
- Bronez T. On the performance advantage of multitaper spectral analysis. IEEE Trans Signal Proc 40: 2941–2946, 1992.
- Percival DB, Walden AT. Spectral Analysis for Physical Applications: Multitaper and Conventional Univariate Techniques. Cambridge, UK: Cambridge Univ. Press, 1993.
- Percival, Donald B., and Andrew T. Walden. Spectral Analysis for Physical Applications: Multitaper and Conventional Univariate Techniques. Cambridge; New York, NY, USA: Cambridge University Press, 1993.
For questions or suggestions please contact Habiba Noamany at hnoamany@bwh.harvard.edu