Remote sensing data is an essential source of information to catch spatiotemporal changes. While ecosystem disturbances detection is of great interest to the community, restoration patterns of degraded landscapes are also worth to be understood. From this perspective, boreal landscapes are an example of special ecosystems representing vast areas of forests. At the same time, such ecosystems are highly vulnerable to disturbance due to low restoration capacity because of harsh climate conditions — first of all, short periods of active temperatures.
For this case, an example of boreal landscapes in the Kola peninsula is studied. Vast vegetation loss had happened due to acid rain exposure and emissions of heavy metals. We can evaluate recent dynamics of vegetation in the impact area by mapping land cover using remote sensing data. For this, Sentinel-2 data was used. The steps of analysis are the following:
- Data preparation ✅
- Acquisition of cloud-free summer composites (using GEE Python API)
- Getting a dataset of spectral signatures and derivatives (spectral indices) by polygons with labelling data
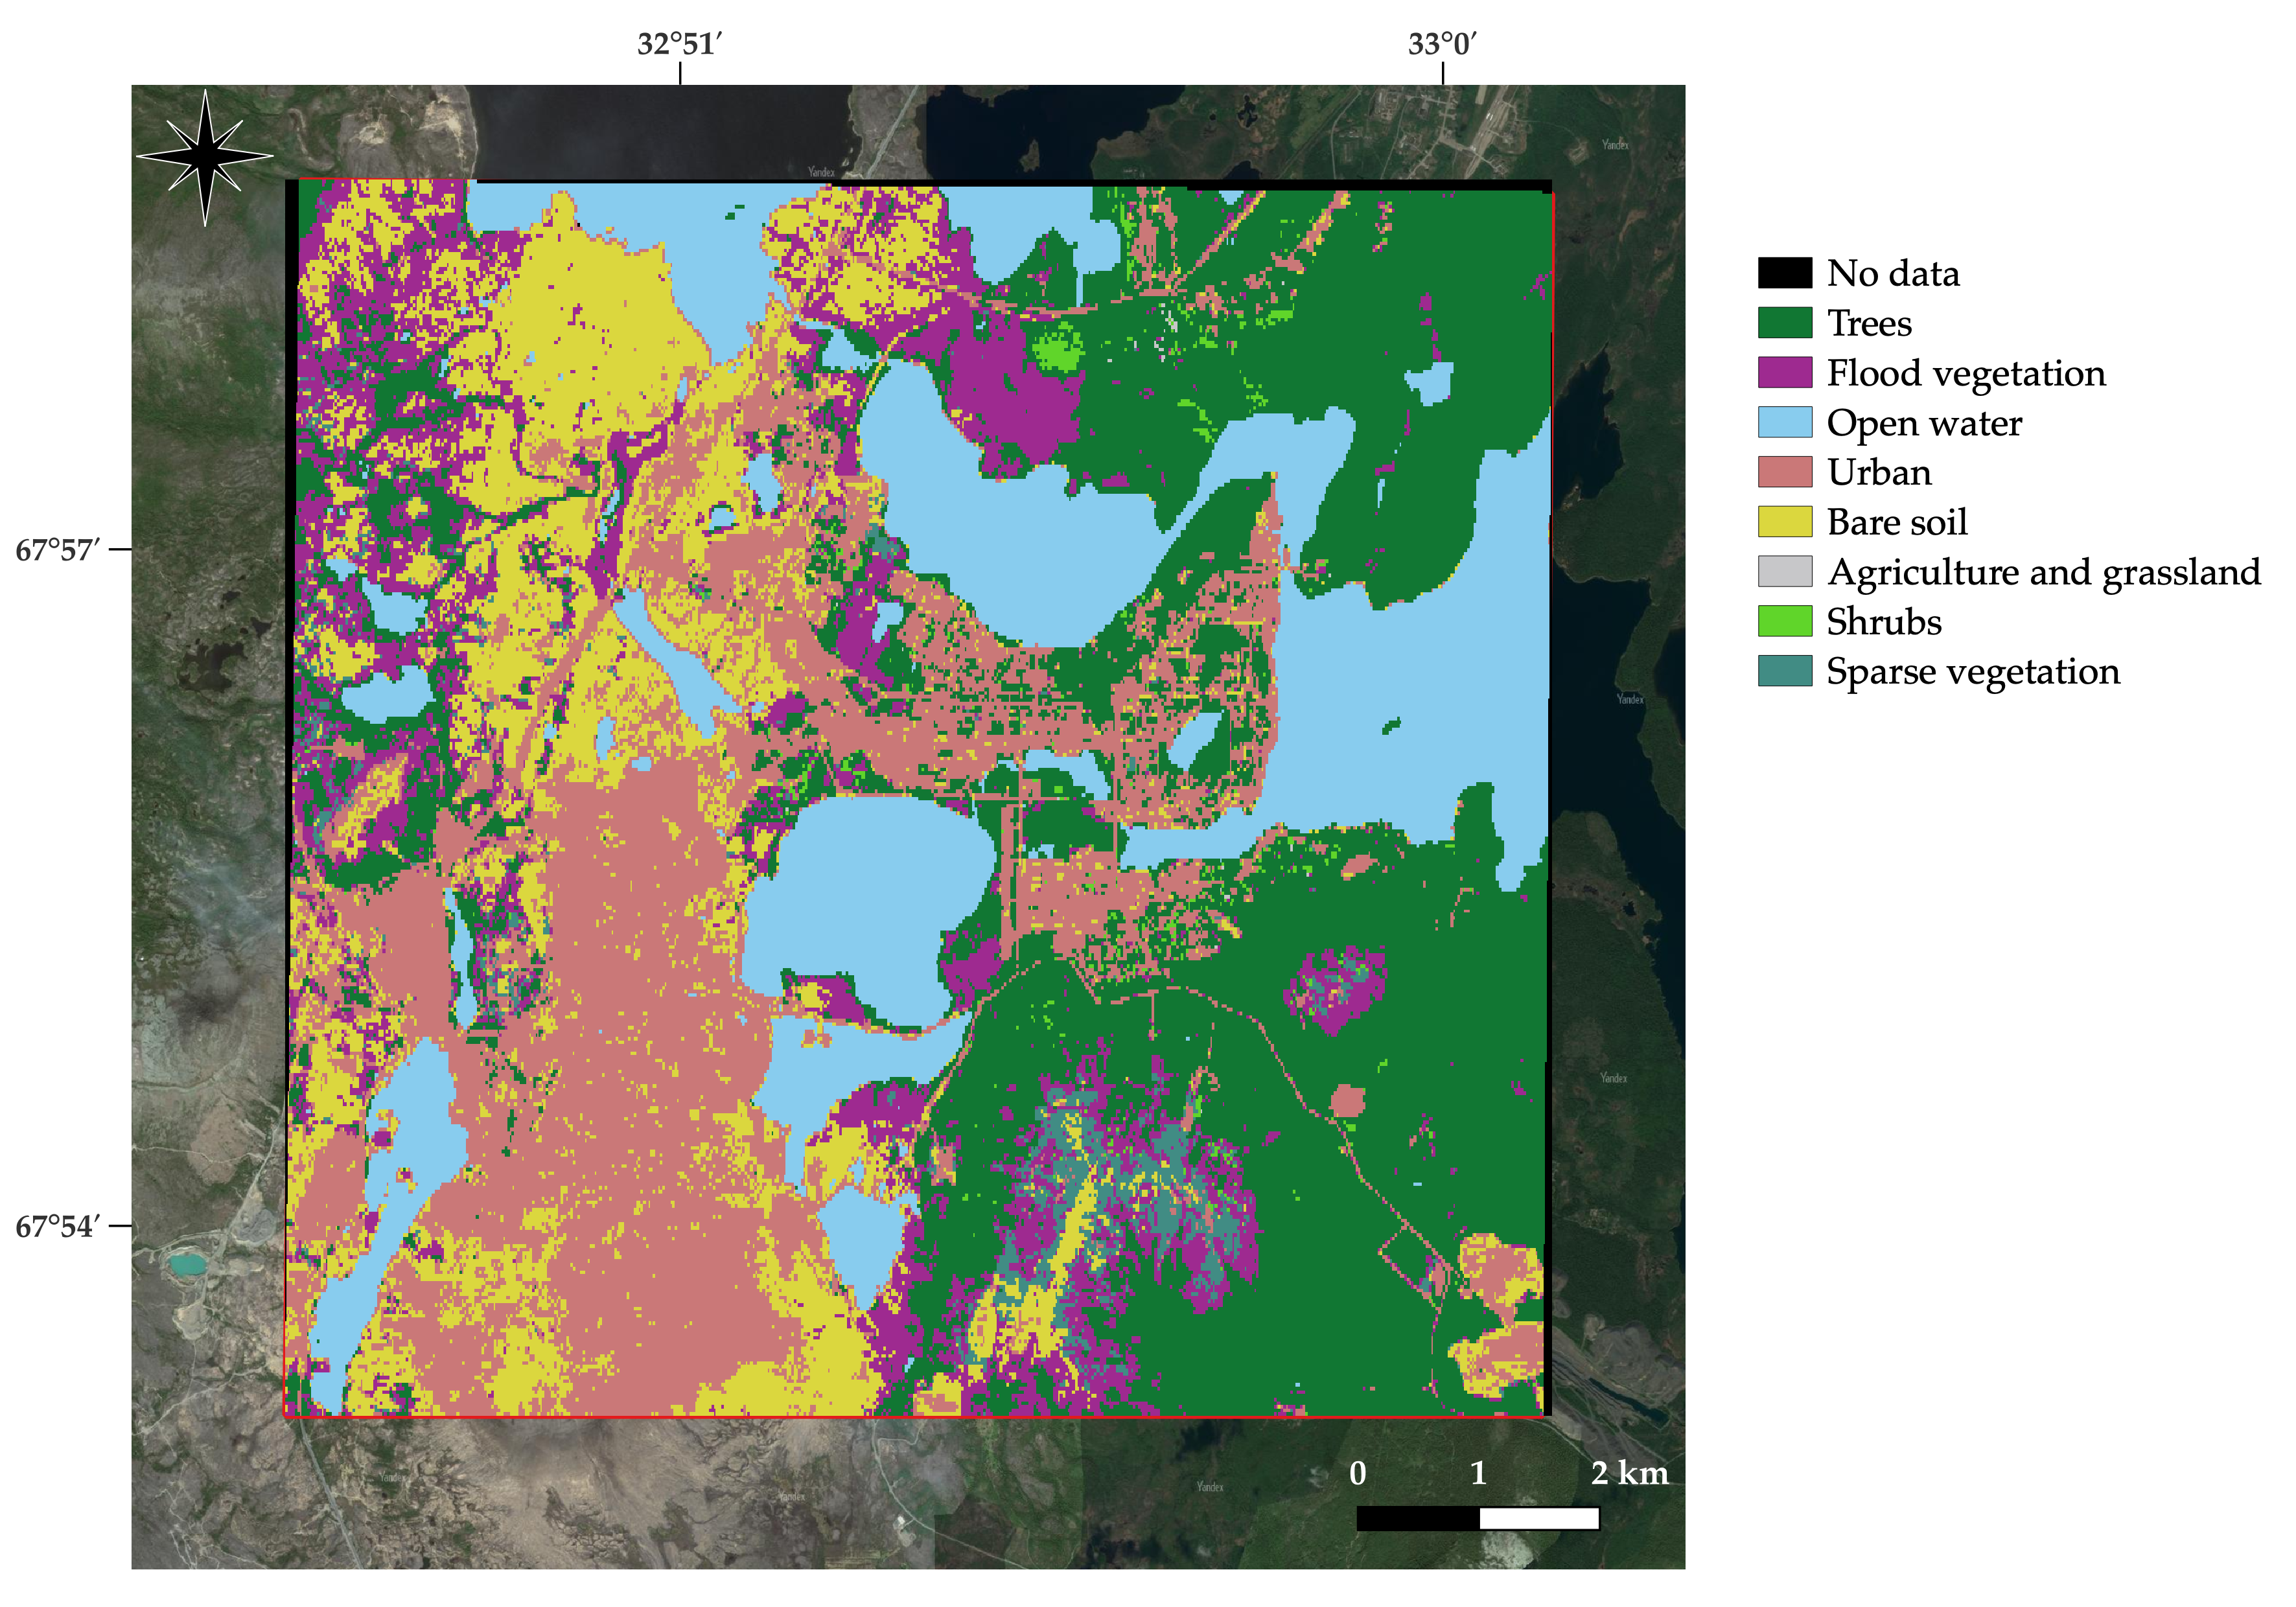
1 - trees
2 - flooded vegetation
3 - open water
4 - urban
5 - bare soil - a target class in which dynamics is of the most interest along with trees
6 - agriculture
7 - shrubs
9 - sparse vegetation
- Land cover mapping ✅
- ML model selection
- Inference obtaining
- Time series analysis 🏗
- Getting land cover maps for available years
- Area analysis from year to year
After experiments, the Random Forest model was selected as the algorithm showing the best performance. As for the limitations, firstly, it should be noted, that in some cases urban and bare soil classes can be mixed up because some of the roads and buildings are located in the areas that lack vegetation, and thus are mixed with bare lands. Additionally, regardless of the level of metrics, visual inspection should be made to match determined classes with actual ones. Finally, the detection of some classes can be missed due to large area of pixel equal to 10x10 m2. However, it is enough to catch the plots of remediation in front of the smelter, which make presented results a promising solution for remote remediation efficiency monitoring. The quality of predictions can be further enhanced by label data enrichment, while other algorithms can be tested to obtain more precise and robust results for semi-automited monitoring solutions development.
-
Geospatial data processing
ee(requires Google Drive account) \folium
geopandas
rasterio
geojson,json -
Data analysis
pandas
bumpy
matplotlib
seaborn -
Data filtration, feature selection, hyper parameters’ optimisation, predictions
scikit-learn