mhrv is a matlab toolbox for calculating Heart-Rate Variability (HRV) metrics
from both ECG signals and RR-interval time series. The toolbox works with ECG
data in the PhysioNet [1] WFDB data format.
-
WFDB wrappers and helpers. A small subset of the PhysioNet WFDB tools are wrapped with matlab functions, to allow using them directly from matlab. For example,
mhrv.wfdb.gqrs- A QRS detection algorithm.mhrv.wfdb.rdsamp- For reading PhysioNet signal data into matlab.mhrv.wfdb.rdann- For reading PhysioNet annotation data into matlab.mhrv.wfdb.wrann- For writing PhysioNet annotation data from matlab datatypes.mhrv.wfdb.wfdb_header- Read record metadata from a WFDB header file (.hea).
-
ECG signal processing. Peak detection and RR interval extraction from ECG data in PhysioNet format. For example,
mhrv.wfdb.rqrs- Detection of R-peaks in ECG signals (based on PhysioNet'sgqrs). Configurable for use with both human and animal ECGs.mhrv.ecg.jqrs/mhrv.ecg.wjqrs- An ECG peak-detector based on a modified Pan & Tompkins algorithm and a windowed version.mhrv.ecg.bpfilt- Bandpass filtering for removing noise artifacts from ECG signals.mhrv.wfdb.ecgrr- Construction of RR intervals from ECG data in PhysioNet format.mhrv.wfdb.qrs_compare- Comparison of QRS detections to reference annotations and calculation of quality measures like Sensitivity, PPV.
-
RR-intervals signal processing. Ectopic beat rejection, frequency filtering, nonlinear dynamic and fractal analysis. For example,
mhrv.rri.filtrr- Filtering of RR interval time series to detect ectopic (out of place) beats.mhrv.rri.dfa- Detrended Fluctuation Analysis, a method of estimating the fractal scaling exponent of a signal [3].mhrv.rri.mse- Multiscale Sample Entropy, a measure of the complexity of the signal computed on multiple time scales [4].mhrv.rri.sample_entropy- Sample Entropy, a measure of the irregularity of a signal.
-
HRV Metrics: Calculating quantitative measures that indicate the activity of the heart based on RR intervals using all standard HRV metrics defined in the literature (see e.g. [2]).
mhrv.hrv.hrv_time- Time Domain: AVNN, SDNN, RMSSD, pNNx.mhrv.hrv.hrv_freq- Frequency Domain:- Total and normalized power in (configurable) VLF, LF, HF and custom user-defined bands.
- Spectral power estimation using Lomb, Auto Regressive, Welch and FFT methods.
- Additional frequency-domain features: LF/HF ratio, LF and HF peak frequencies, power-law scaling exponent (beta).
mhrv.hrv.hrv_nonlinear- Nonlinear methods:- Short- and long-term scaling exponents (alpha1, alpha2) based on DFA.
- Sample Entropy and Multiscale sample entropy (MSE).
- Poincaré plot metrics (SD1, SD2).
mhrv.hrv.hrv_fragmentation- Time-domain RR interval fragmentation analysis [5].
-
Configuration: The toolbox is fully configurable with many user-adjustable parameters.
- The configuration files are in human-readable YAML format which is easy to edit and extend.
- The user can create custom configurations files based on the
defatuls.ymlfile (only overriding what's required). - Custom configuration files can be loaded with a single call which updates
the defaults for the entire toolbox. This allows simple, reproducible
analysis of different datasets that require different analysis
configurations. See the
mhrv.defaultspackage. - The settings for any of the functions can either be configured globally
with configuration
ymlfiles or on a per-call basis with matlab-style key-value argument pairs.
-
Plotting: All toolbox functions support plotting their output for data visualization. The plotting code is separated from the algorithmic code in order to simplify embedding this toolbox in other matlab applications. See the
mhrv.plotspackage. -
Top-level analysis functions: These functions work with PhysioNet records and allow streamlined HRV analysis by composing the functions of this toolbox.
mhrv.mhrv- Analyzes a single PhysioNet record (ECG data or annotations), optionally split into multiple analysis windows. Extracts all supported HRV features and optionally generates plots.mhrv.mhrv_batch- Analyzes many PhysioNet records (ECG data or annotations) which can be further separated into user-defined groups (e.g. Control, Test). Automatically computes HRV metrics per group and generates a comparative summary of the HRV features in each group.
- Matlab with Signal Processing toolbox. Should work on Matlab R2014b or newer.
- The PhysioNet WFDB tools. The toolbox can install this for you.
-
Clone the repo or download the source code.
-
From matlab, run the
mhrv_initfunction from the root of the repo. This function will:- Check for the presence of the WFDB tools in your system
PATH. - If WFDB tools are not detected, it will attempt to automatically download
them for you into the folder
bin/wfdbunder the repository root. - Set up your MATLAB path to include the code from this toolbox.
- Check for the presence of the WFDB tools in your system
Matlab maintains a PWD, or "present working directory". It's the folder you see
at the top of the interface, containing the files you see in the file explorer
pane. Type pwd at the matlab command prompt to see it's value.
Additionally, matlab maintains a PATH variable, containing a list of folders in
which it searches for function definitions (similar to the shell PATH concept).
Type path at the matlab command prompt to see it's value.
You don't need to change your pwd to the root of the repo folder for the
toolbox to work. You can simple run the mhrv_init function from your current
pwd, and it will take care of updating matlab's path. For example, if you
cloned or downloaded the toolbox in the folder /Users/myname/mhrv/, you can
run the following command from the matlab prompt:
run /Users/myname/mhrv/mhrv_init.mAfter this the toolbox will be ready to use, regardless of your pwd.
The above steps should be enough to get most users started.
In some cases mhrv_init may fail to download the correct binaries for you, or
you may want to install them yourself.
- On macOS, you can use homebrew. First install homebrew,
then install
wfdbwithbrew tap brewsci/science && brew install -s wfdb. - On any OS (including macOS), you can compile the WFDB binaries from source using the instructions on their website.
Once you have the binaries, place them in some folder on your $PATH or
somewhere under the repo's root folder (bin/wfdb would be a good choice as it's
.gitignored) and they will be found and used automatically.
You can replace the binaries that were automatically downloaded with your
compiled ones. If you used homebrew, they should already be on your $PATH.
If you would like to manually specify a path outside the repo which contains the
WFDB binaries (e.g. /usr/local/bin for a homebrew install), you can edit
cfg/defaults.yml
and set the mhrv.paths.wfdb_path variable to the desired path.
For macOS users it's recommended to install with homebrew, and for linux users it's recommended to install from source, as the binaries provided on the PhysioNet website are very outdated.
Documentation is available on readthedocs.
Exaple of calculating HRV measures for a PhysioNet record downloaded from
PhysioNet (in this case from
mitdb):
% Download the mitdb/111 record from PhysioNet to local folder named 'db'
>> mhrv.wfdb.download_wfdb_records('mitdb', '111', 'db');
[0.210] >> mitdb: Found 48 records
[0.300] >> mitdb: Found 1 annotators
[0.400] >> mitdb: Downloaded: 111.hea -> db/mitdb/111.hea
[0.500] >> mitdb: Downloaded: 111.atr -> db/mitdb/111.atr
[1.030] >> mitdb: Downloaded: 111.dat -> db/mitdb/111.dat
[1.040] >> mitdb: Done, 1 records downloaded.
% Run HRV analysis
>> mhrv.mhrv('db/mitdb/111', 'window_minutes', 15, 'plot', true);
[0.010] >> mhrv: Processing record db/mitdb/111 (ch. 1)...
[0.010] >> mhrv: Signal duration: 00:30:05.555 [HH:mm:ss.ms]
[0.020] >> mhrv: Analyzing window 1 of 2...
[0.020] >> mhrv: [1/2] Detecting RR intervals from ECG... 1046 intervals detected.
[0.280] >> mhrv: [1/2] Removing ectopic intervals... 13 intervals removed.
[0.300] >> mhrv: [1/2] Calculating time-domain metrics...
[0.310] >> mhrv: [1/2] Calculating frequency-domain metrics...
[0.580] >> mhrv: [1/2] Calculating nonlinear metrics...
[0.660] >> mhrv: [1/2] Calculating fragmentation metrics...
[0.680] >> mhrv: Analyzing window 2 of 2...
[0.680] >> mhrv: [2/2] Detecting RR intervals from ECG... 1065 intervals detected.
[0.930] >> mhrv: [2/2] Removing ectopic intervals... 4 intervals removed.
[0.950] >> mhrv: [2/2] Calculating time-domain metrics...
[0.960] >> mhrv: [2/2] Calculating frequency-domain metrics...
[1.110] >> mhrv: [2/2] Calculating nonlinear metrics...
[1.180] >> mhrv: [2/2] Calculating fragmentation metrics...
[1.190] >> mhrv: Building statistics table...
[1.200] >> mhrv: Displaying Results...
RR NN AVNN SDNN RMSSD pNN50 SEM BETA_LOMB HF_NORM_LOMB HF_PEAK_LOMB HF_POWER_LOMB LF_NORM_LOMB LF_PEAK_LOMB LF_POWER_LOMB LF_TO_HF_LOMB TOTAL_POWER_LOMB VLF_NORM_LOMB VLF_POWER_LOMB SD1 SD2 alpha1 alpha2 SampEn PIP IALS PSS PAS
______ ____ ______ ______ _______ _______ _______ _________ ____________ ____________ _____________ ____________ ____________ _____________ _____________ ________________ _____________ ______________ _______ ______ ________ _______ _________ _______ _________ ______ ______
1 1046 1033 858.95 30.958 33.598 14.05 0.96322 -1.1881 63.899 0.16744 443.95 6.6518 0.056809 46.214 0.1041 694.76 25.832 179.47 23.769 36.77 0.64751 0.69834 1.8402 52.662 0.5281 60.213 11.81
2 1065 1061 841.79 40.042 31.725 12.075 1.2293 -1.4542 51.529 0.16744 394.82 6.7584 0.044849 51.783 0.13116 766.21 35.367 270.99 22.444 51.96 0.70254 0.93526 1.8466 51.555 0.51698 55.702 14.138
Mean 1055.5 1047 850.37 35.5 32.662 13.063 1.0963 -1.3212 57.714 0.16744 419.38 6.7051 0.050829 48.999 0.11763 730.48 30.6 225.23 23.106 44.365 0.67502 0.8168 1.8434 52.109 0.52254 57.958 12.974
SE 9.5 14 8.581 4.5421 0.93663 0.98746 0.13305 0.13306 6.1852 0 24.564 0.053267 0.0059799 2.7844 0.013529 35.724 4.7674 45.757 0.66276 7.5954 0.027515 0.11846 0.0032216 0.55351 0.0055598 2.2554 1.1637
Median 1055.5 1047 850.37 35.5 32.662 13.063 1.0963 -1.3212 57.714 0.16744 419.38 6.7051 0.050829 48.999 0.11763 730.48 30.6 225.23 23.106 44.365 0.67502 0.8168 1.8434 52.109 0.52254 57.958 12.974
[1.220] >> mhrv: Generating plots...
[3.260] >> mhrv: Finished processing record db/mitdb/111.
The window_minutes parameter allow splitting the signal into windows and
calculating all metrics per window. You can pass in an empty array [] to
disable spliting.
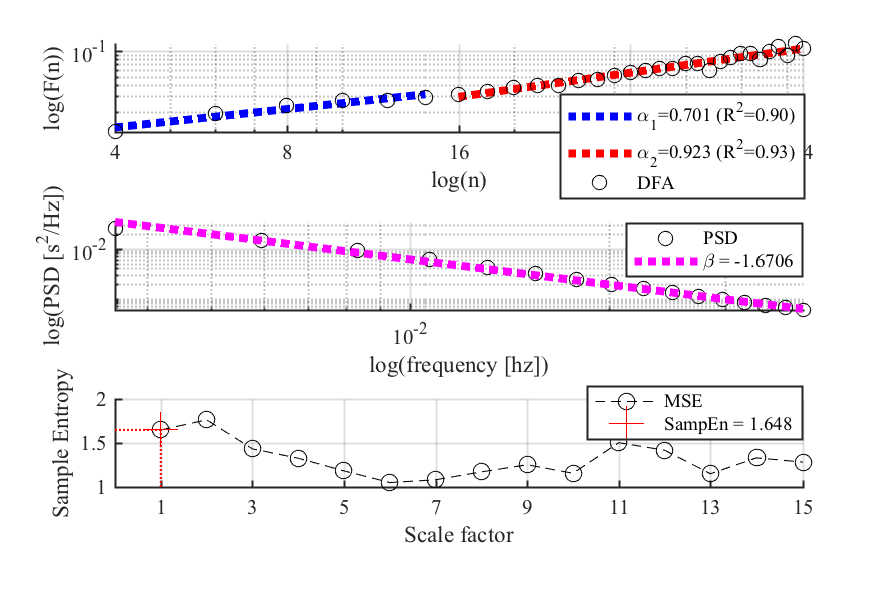
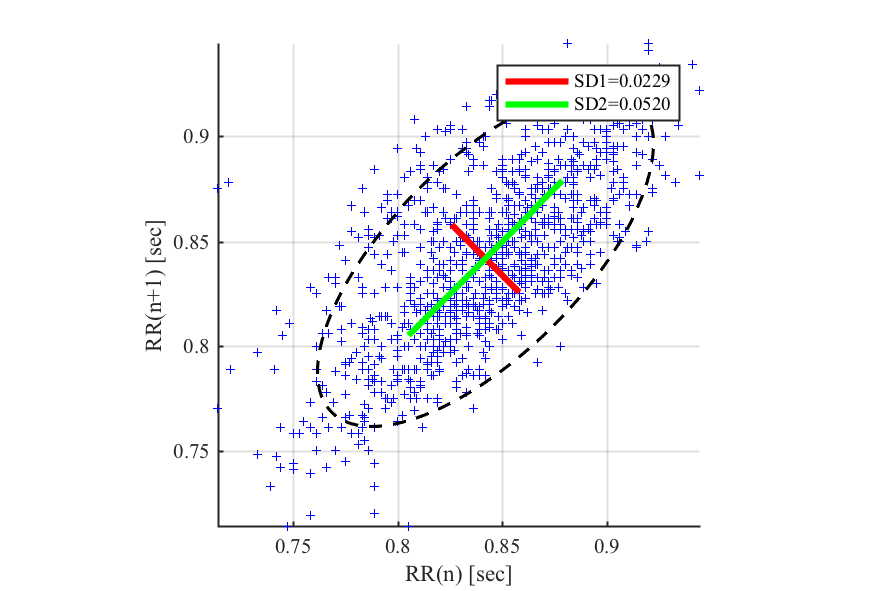
Example plots (generated by the example above):
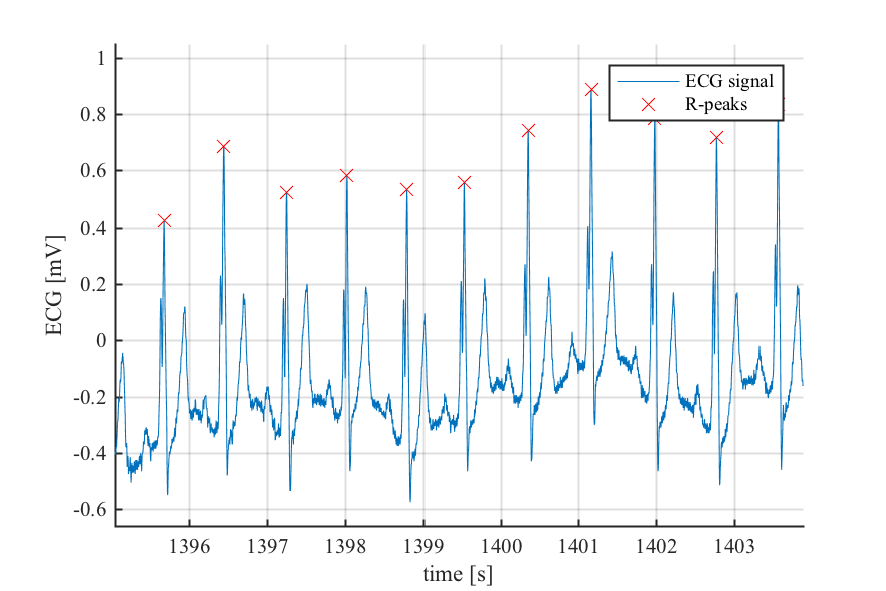
- ECG R-peak detection

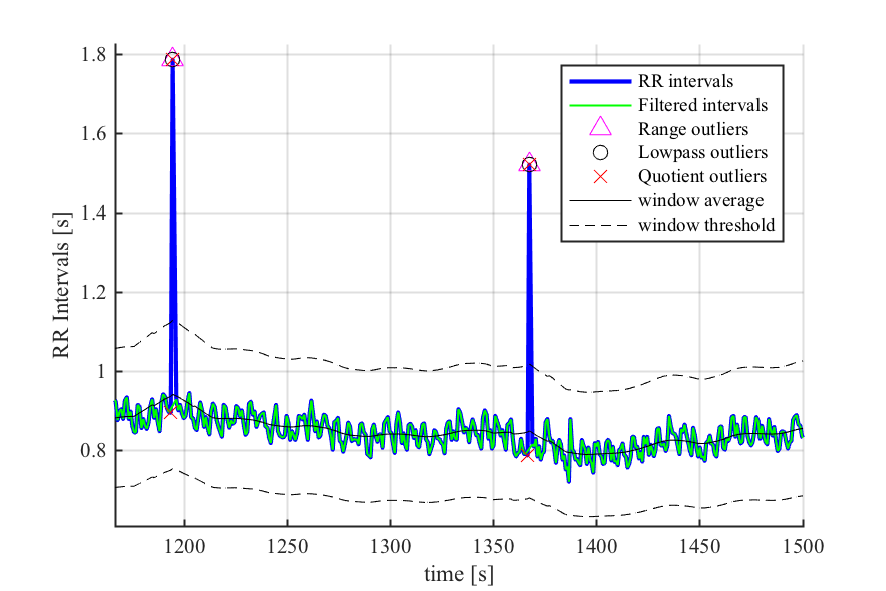
- RR interval time series filtering

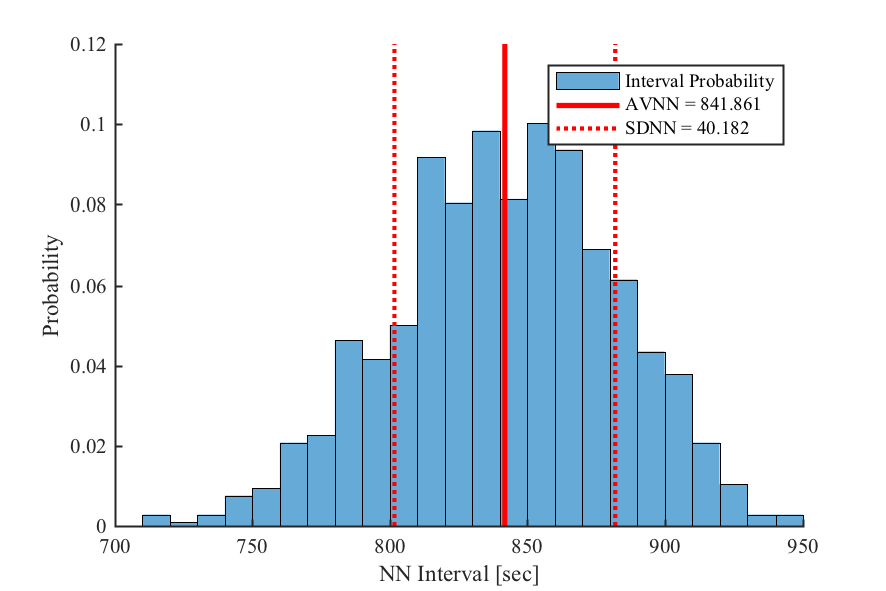
- Time-domain HRV Metrics

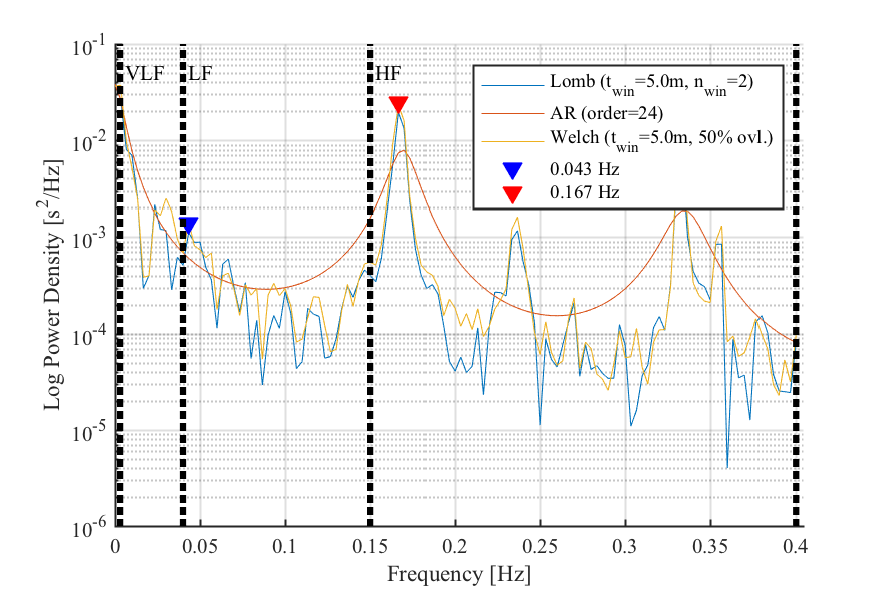
- Spectrum of interval time series

- Nonlinear HRV Metrics

- Poincaré plot and ellipse fitting

This toolbox, initially called rhrv, was created as part of my MSc research
thesis. It was then renamed and updated to be used as the basis of the
PhysioZoo platform for HRV analysis of human and
animal data.
To use it in you own research, please cite:
-
Rosenberg, A. A. (2018) ‘Non-invasive in-vivo analysis of intrinsic clock-like pacemaker mechanisms: Decoupling neural input using heart rate variability measurements.’ MSc Thesis. Technion, Israel Institute of Technology.
-
Behar J. A., Rosenberg A. A. et al. (2018) ‘PhysioZoo: a novel open access platform for heart rate variability analysis of mammalian electrocardiographic data.’ Frontiers in Physiology.
Several other projects exist with various levels of overlapping functionality and purpose.
- The PhysioNet WFDB tools.
- The WFDB toolbox for matlab.
- The R-HRV toolbox for the R language.
- The Kubios software package.
- The PhysioZoo platform for mammalian ECG and HRV analysis.
Some of the code in lib/ was created by others, used here as dependencies.
Original author attribution exists in the source files.
Feel free to send pull requests or open issues via GitHub.
- Goldberger, A. L. et al. (2000) ‘PhysioBank, PhysioToolkit, and PhysioNet’, Circulation, 101(23), pp. E215-20.
- Task Force of the European Society of Cardiology and the North American Society of Pacing and Electrophysiology. (1996) ‘Heart rate variability. Standards of measurement, physiological interpretation, and clinical use.’, European Heart Journal, 17(3), pp. 354–81.
- Peng, C.-K., Hausdorff, J. M. and Goldberger, A. L. (2000) ‘Fractal mechanisms in neuronal control: human heartbeat and gait dynamics in health and disease, Self-organized biological dynamics and nonlinear control.’ Cambridge: Cambridge University Press.
- Costa, M. D., Goldberger, A. L. and Peng, C.-K. (2005) ‘Multiscale entropy analysis of biological signals’, Physical Review E - Statistical, Nonlinear, and Soft Matter Physics, 71(2), pp. 1–18.
- Costa, M. D., Davis, R. B. and Goldberger, A. L. (2017) ‘Heart Rate Fragmentation : A New Approach to the Analysis of Cardiac Interbeat Interval Dynamics’, Frontiers in Physiology, 8(May), pp. 1–13.