This is a simple charting library for rendering charts as images using GDI+.
.NET Standard 2.0
After creating a chart instance, you just need to call:
var image = chart.CreateImage();- Pie Chart
- Donut Chart
- Bar Chart
- Stacked Bar Chart
- Double Axis Bar Chart
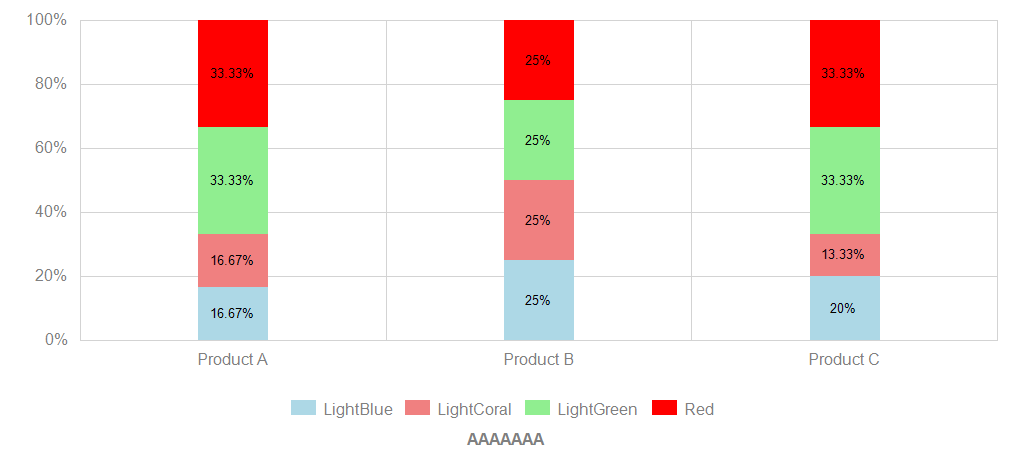
- 100% Stacked Bar Chart
- Column Chart
- 100% Stacked Column Chart
- Radar Chart
- Single Range Bar Chart
- Semi Circle Gauge Chart
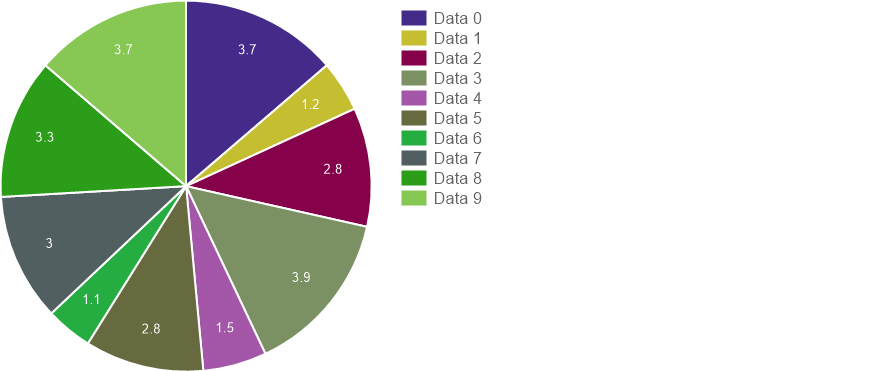
Create sample data:
private static PieEntry[] CreatePieEntries()
{
    var rand = new Random();
    var entries = new PieEntry[10];
    for (int i = 0; i < entries.Length; i++)
    {
        entries[i] = new PieEntry
        {
            Value = (float)rand.Next(10, 40) / 10,
            Color = Color.FromArgb(rand.Next(0, 200), rand.Next(0, 200), rand.Next(0, 200)),
            Label = "Data " + i
        };
    }

    return entries;
}
Create chart:
PieEntry[] entries = CreatePieEntries();

var chart = new PieChart
{
    Width = 300,
    Height = 600,
    Entries = entries
};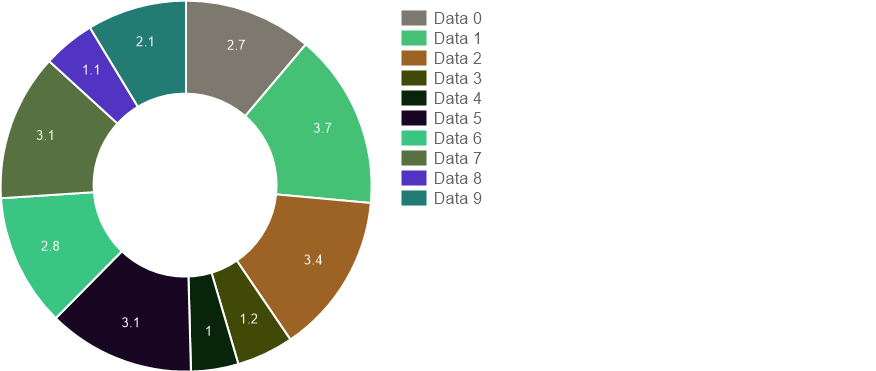
PieEntry[] entries = CreatePieEntries();

var chart = new PieChart
{
    Width = 300,
    Height = 600,
    Entries = entries,
    IsDonut = true // default: false
};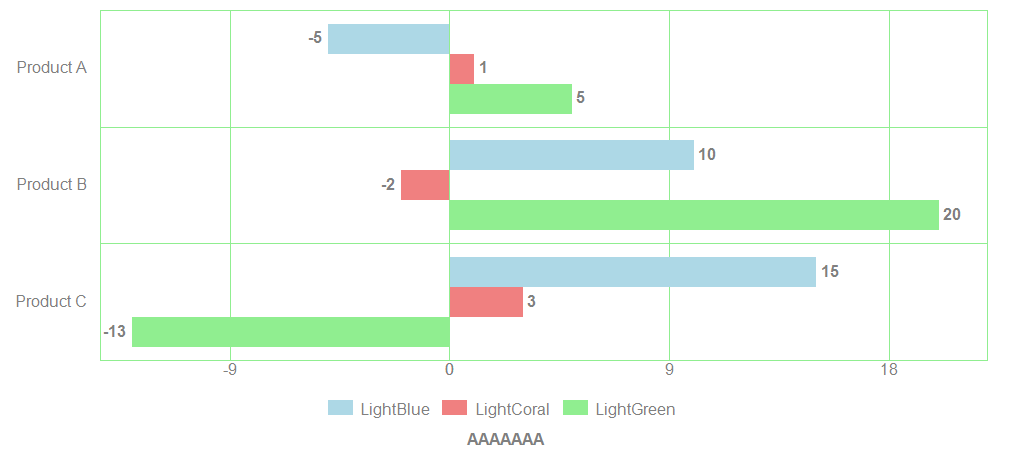
var chart = new BarChart
{
    Legend = new LegendModel
    {
        Margin = new PointF(0, 40),
        VerticalAlign = VerticalAlign.Bottom,
        HorizontalAlign = HorizontalAlign.Center
    },
    ChartGridModel = new ChartGridModel
    {
        LineColor = Color.LightGreen
    },
    SubTitle = new SubTitleModel { Text = "AAAAAAA" },
    Size = size,
    Categories = new[] { "Product A", "Product B", "Product C" },
    DataSet = new[]
    {
        new DataSeries
        {
            Label = "LightBlue",
            Color = Color.LightBlue,
            Data = new[] { -5f, 10f, 15f },
        },
        new DataSeries
        {
            Label = "LightCoral",
            Color = Color.LightCoral,
            Data = new[] { 1f, -2f, 3f },
        }
        ,
        new DataSeries
        {
            Label = "LightGreen",
            Color = Color.LightGreen,
            Data = new[] { 5f, 20f, -13f },
        }
    }
};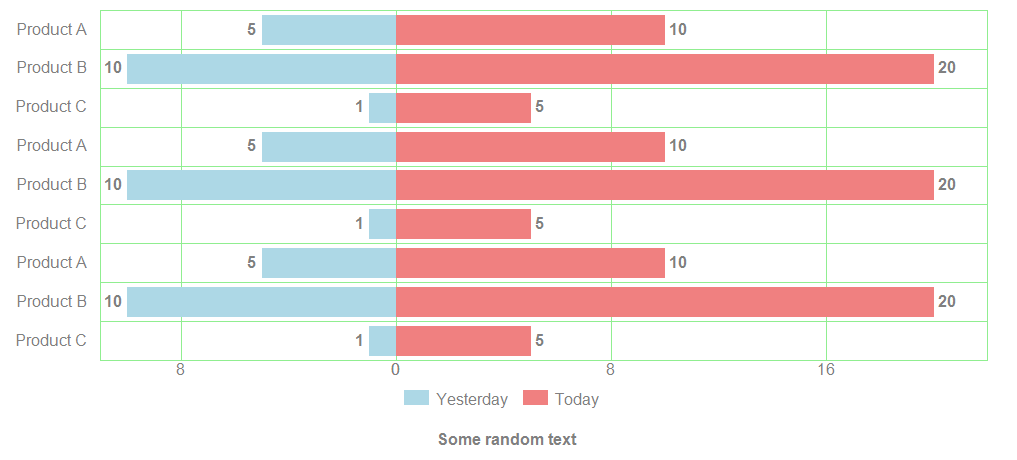
var chart = new BarChart
{
    Legend = new LegendModel
    {
        Margin = new PointF(0, 50),
        VerticalAlign = VerticalAlign.Bottom
    },
    ChartGridModel = new ChartGridModel
    {
        LineColor = Color.LightGreen
    },
    BarSetting = new BarSettingModel
    {
        IsStacked = true,
        FormatValue = "{0:0;0}",
    },
    SubTitle = new SubTitleModel { Text = "Some random text" },
    Size = size,
    FormatAxisValue = "{0:0;0}", // force positive values
    Categories = new[] { "Product A", "Product B", "Product C", "Product A", "Product B", "Product C", "Product A", "Product B", "Product C" },
    DataSet = new[]
    {
        new DataSeries
        {
            Label = "Yesterday",
            Color = Color.LightBlue,
            Data = new[] { -5f, -10f, -1f , -5f, -10f, -1f , -5f, -10f, -1f },
        },
        new DataSeries
        {
            Label = "Today",
            Color = Color.LightCoral,
            Data = new[] { 10f, 20f, 5f, 10f, 20f, 5f, 10f, 20f, 5f },
        }
    }
};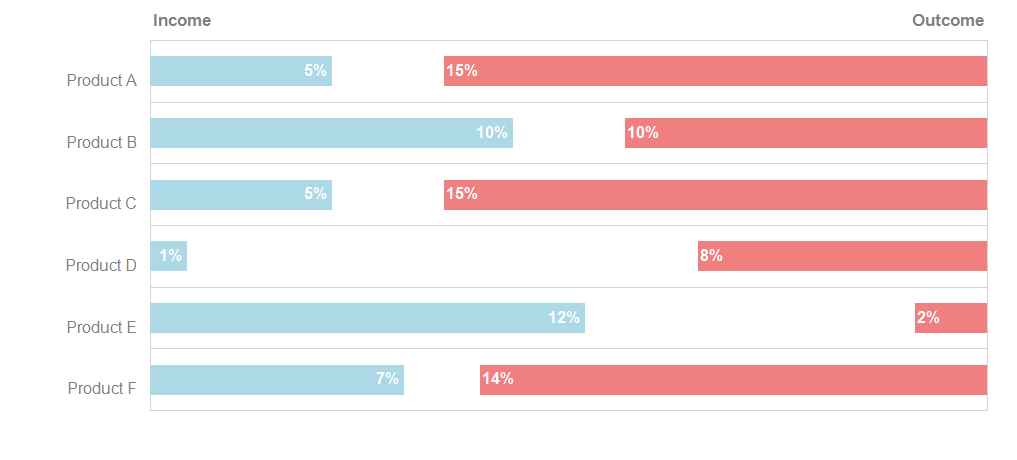
var chart = new DoubleAxisBarChart
{
    FormatBarValue = "{0}%",
    Size = size,
    Categories = new[] { "Product A", "Product B", "Product C", "Product D", "Product E", "Product F" },
    FirstDataSet = new DoubleAxisBarSeries
    {
        Label = "Income",
        Color = Color.LightBlue,
        Data = new[] { 5f, 10f, 5f, 1f, 12f, 7f },
    },
    SecondDataSet = new DoubleAxisBarSeries
    {
        Label = "Outcome",
        Color = Color.LightCoral,
        Data = new[] { 15f, 10f, 15f, 8f, 2f, 14f },
    }
};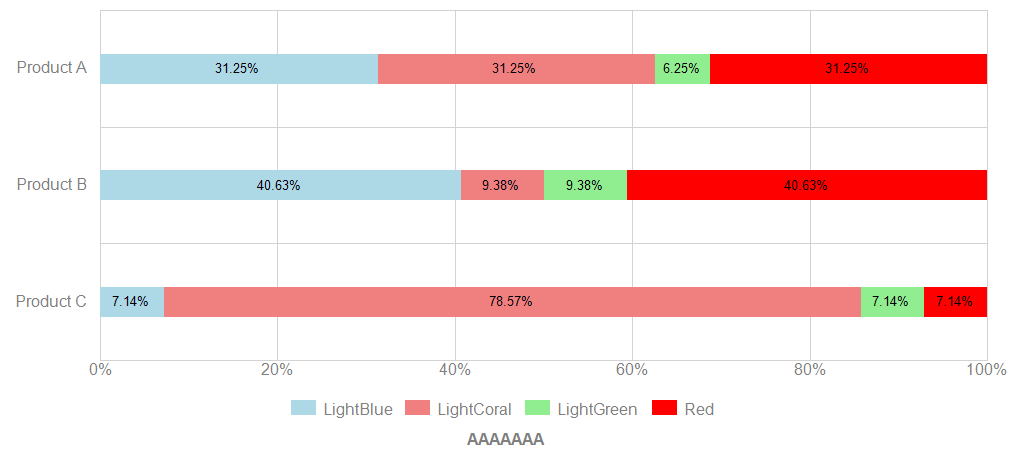
var chart = new StackedBar100Chart
{
    Legend = new LegendModel
    {
        Margin = new PointF(0, 40),
        VerticalAlign = VerticalAlign.Bottom,
        HorizontalAlign = HorizontalAlign.Center
    },
    SubTitle = new SubTitleModel { Text = "AAAAAAA" },
    Size = size,
    Categories = new[] { "Product A", "Product B", "Product C" },
    DataSet = new[]
    {
        new DataSeries
        {
            Label = "LightBlue",
            Color = Color.LightBlue,
            Data = new[] { 25f, 13f, 3f },
        },
        new DataSeries
        {
            Label = "LightCoral",
            Color = Color.LightCoral,
            Data = new[] { 25f, 3f, 33f },
        }
        ,
        new DataSeries
        {
            Label = "LightGreen",
            Color = Color.LightGreen,
            Data = new[] { 5f, 3f, 3f },
        },
        new DataSeries
        {
            Label = "Red",
            Color = Color.Red,
            Data = new[] { 25f, 13f, 3f },
        }
    }
};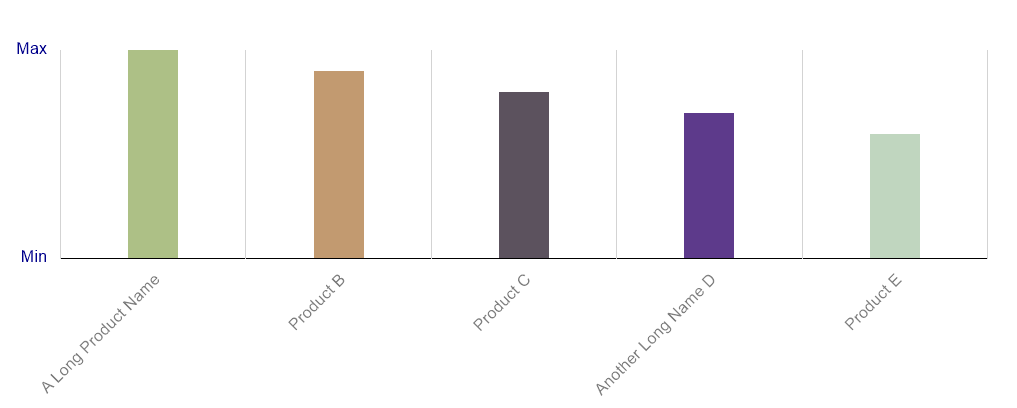
var categories = new[] { "A Long Product Name", "Product B", "Product C", "Another Long Name D", "Product E" };
var rand = new Random();
var datasets = new ColumnSeries[1];
var colors = new Color[categories.Length];
for (int i = 0; i < colors.Length; i++)
{
    colors[i] = Color.FromArgb(rand.Next(0, 256), rand.Next(0, 256), rand.Next(0, 256));
}

for (int i = 0; i < datasets.Length; i++)
{
    var data = new float[categories.Length];
    for (int j = 0; j < categories.Length; j++)
    {
        data[j] = 100 - (j * 10);
    }

    datasets[i] = new ColumnSeries
    {
        Colors = colors,
        Data = data
    };
}

var chart = new ColumnChart
{
    Padding = new Padding(60, 50, 30, 150),
    YAxisMinText = "Min",
    YAxisMaxText = "Max",
    ColumnValuesVisible = false,
    IsOneHundredPercentChart = true,
    ColumnSize = 50,
    Size = size,
    Categories = categories,
    DataSets = datasets,
};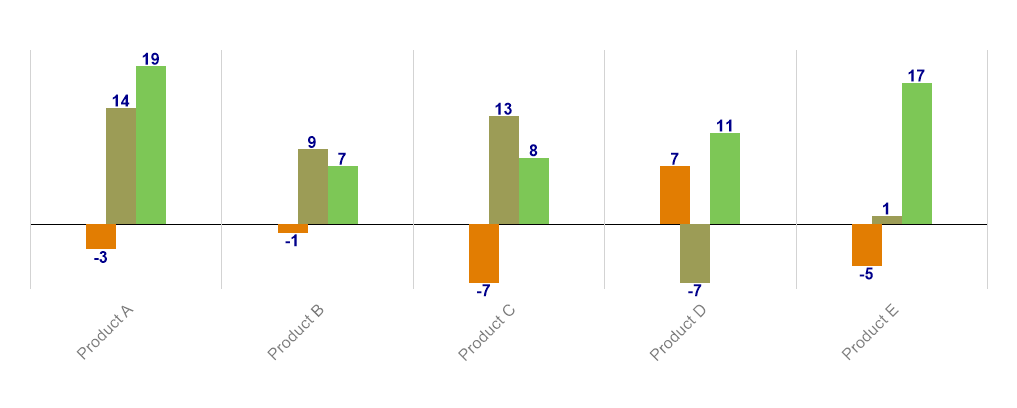
var categories = new[] { "Product A", "Product B", "Product C", "Product D", "Product E" };
var rand = new Random();
var datasets = new ColumnSeries[3];
for (int i = 0; i < datasets.Length; i++)
{
    var data = new float[categories.Length];
    for (int j = 0; j < categories.Length; j++)
    {
        data[j] = rand.Next(30) - 10;
    }

    var dataset = new ColumnSeries
    {
        Color = Color.FromArgb(rand.Next(0, 256), rand.Next(0, 256), rand.Next(0, 256)),
        Data = data
    };
    datasets[i] = dataset;
}

datasets[0].OffsetX = 10;
var chart = new ColumnChart
{
    ColumnSize = 30,
    Size = size,
    Categories = categories,
    DataSets = datasets
};
var chart = new StackedColumn100Chart
{
    Legend = new LegendModel
    {
        Margin = new PointF(0, 40),
        VerticalAlign = VerticalAlign.Bottom,
        HorizontalAlign = HorizontalAlign.Center
    },
    Padding = new Padding(80, 20, 20, 120),
    BarSetting = new BarSettingModel
    {
        Size = 70,
    },
    SubTitle = new SubTitleModel { Text = "AAAAAAA" },
    Size = size,
    Categories = new[] { "Product A", "Product B", "Product C" },
    DataSet = new[]
    {
        new DataSeries
        {
            Label = "LightBlue",
            Color = Color.LightBlue,
            Data = new[] { 25f, 3f, 3f },
        },
        new DataSeries
        {
            Label = "LightCoral",
            Color = Color.LightCoral,
            Data = new[] { 25f, 3f, 2f },
        }
        ,
        new DataSeries
        {
            Label = "LightGreen",
            Color = Color.LightGreen,
            Data = new[] { 50f, 3f, 5f },
        }
        ,
        new DataSeries
        {
            Label = "Red",
            Color = Color.Red,
            Data = new[] { 50f, 3f, 5f },
        }
    }
};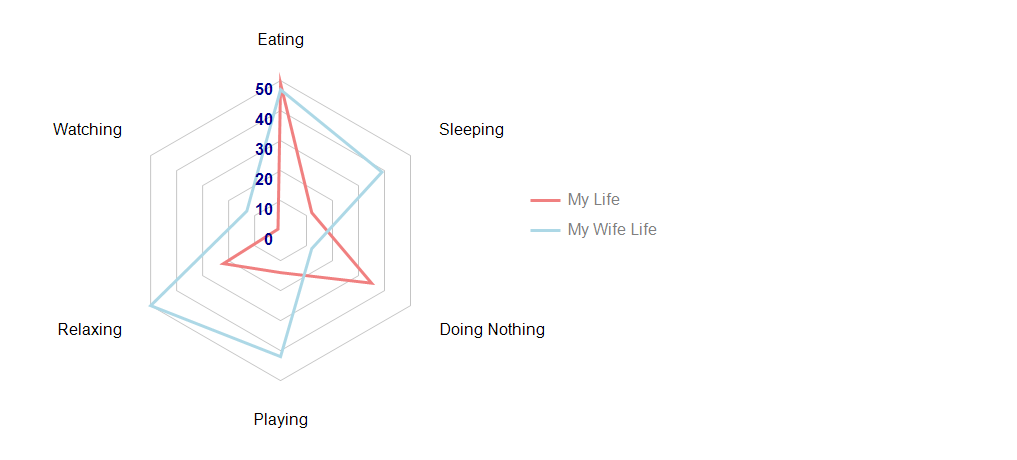
var categories = new[] { "Eating", "Sleeping", "Doing Nothing", "Playing", "Relaxing", "Watching" };
var chart = new RadarChart
{
    //   MaxDataValue = 100,
    StepSize = 10,
    Size = size,
    Categories = categories,
    DataSets = new[]
    {
        new RadarChartSeries
        {
            Label = "My Life",
            Color = Color.LightCoral,
            Data = GenerateRandomArray(random, categories.Length, 1, 50),
        },
        new RadarChartSeries
        {
            Label = "My Wife Life",
            Color = Color.LightBlue,
            Data = GenerateRandomArray(random, categories.Length, 1, 100),
        }
    }
};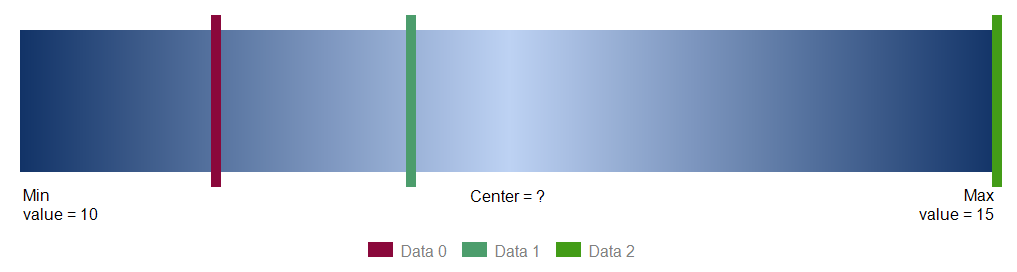
const float MinValue = 10;
const float MaxValue = 15;
var values = new[] { 11, 12, 15 };
var rand = new Random();
var entries = new SingleRangeBarEntry[values.Length];

for (int i = 0; i < entries.Length; i++)
{
    entries[i] = new SingleRangeBarEntry
    {
        Value = values[i],
        Color = Color.FromArgb(rand.Next(0, 200), rand.Next(0, 200), rand.Next(0, 200)),
        Label = "Data " + i
    };
}

var chart = new SingleRangeBarChart
{
    MinValue = MinValue,
    MaxValue = MaxValue,
    Size = size,
    Entries = entries,
    LeftLabel = "Min \nvalue = 10",
    CenterLabel = "Center = ?",
    RightLabel = "Max \nvalue = 15",
    Font = new SlimFont("Arial", 12),
    TextColor = Color.Black
};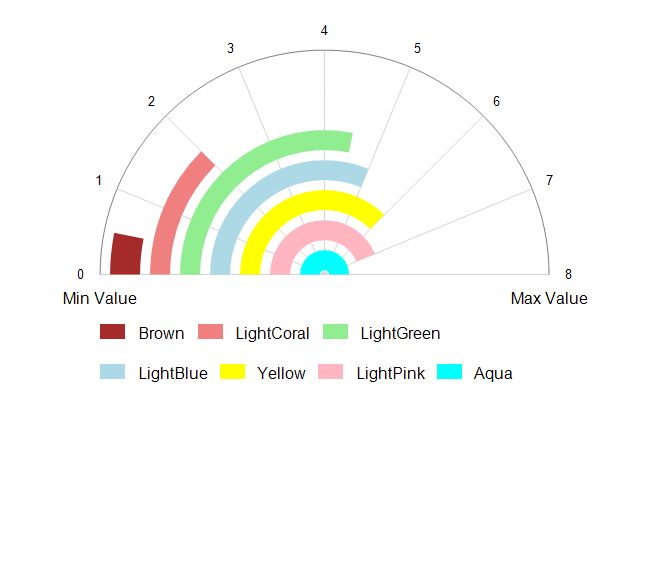
var chart = new SemiCircleGaugeChart
{
    Legend = new LegendModel
    {
        Margin = new PointF(40, 80),
        VerticalAlign = VerticalAlign.Bottom,
        HorizontalAlign = HorizontalAlign.Center
    },
    MaxValue = 8,
    Size = size,
    DataItems = new[]
    {
        new DataItem { Color = Color.Brown, Value = 0.5f, Label = "Brown" },
        new DataItem { Color = Color.LightCoral, Value = 2, Label = "LightCoral" },
        new DataItem { Color = Color.LightGreen, Value = 4.5f, Label = "LightGreen" },
        new DataItem { Color = Color.LightBlue, Value = 5, Label = "LightBlue" },
        new DataItem { Color = Color.Yellow, Value = 6, Label = "Yellow" },
        new DataItem { Color = Color.LightPink, Value = 7, Label = "LightPink" },
        new DataItem { Color = Color.Aqua, Value = 8, Label = "Aqua" },
    }
};MIT