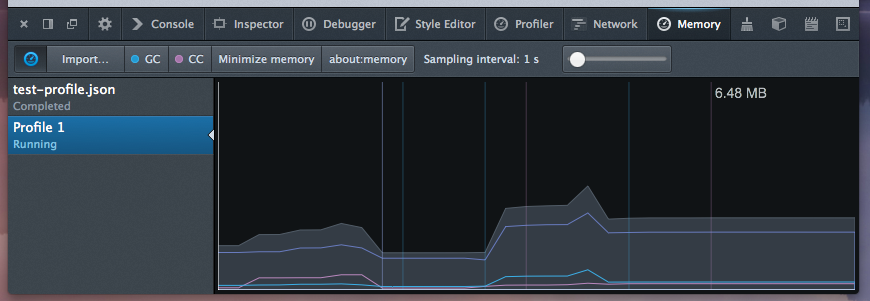
An add-on for Firefox Developer Tools that allows inspection of the memory consumption of a page. The add-on adds a new 'Memory' tab to the toolbox, which can even be toggled from the toolbox options panel. It works by sampling the memory consumption of the browser every second and retaining the measurements relevant to the current tab. It then creates a graph that shows the changes in the page's memory footprint over time, making it possible to identify leaks or erratic behavior.
The stopwatch button toggles profiling and the about:memory button, you guessed it, opens about:memory. The grey area displays the total memory footprint of the page at any given time. The blue line plots the amount of JavaScript objects while the pink line plots the memory consumption of DOM elements. Vertical lines indicate a garbage or cycle collection event, with the colors matching the type of object they affect (i.e. blue for GC, pink for CC).
Pre-build packages can be found in the build/ directory.