This is the python class, that use ROOT framework to make 📈 data vizualization 📉 easier. The main function - draw different values in one frame, without carring about ranges and additional axises. This is especially useful when you need to display the dependence of different values from one value.
⚠️ Please pay attention, that the class is in development and there are many bugs here⚠️
Tested on Ubuntu 14.04.LTS with Python2.7.6 & ROOT 5.36/34
MultiAxisGraph is realy 'DoubleAxisGraph', so multiple axises is in development. This class interface allows you to compose graphs (ROOT.TGraph) and setting up axises for them (on this moment only two). Usage of MultiAxisGraph (MAG) object can be divided into the following stages:
- Creating TGraphs objects & setting their properties
- Adding TGraph objects to MultiAxisGraph using modes & draw MAG object
- Getting MAG attributes & setting up their properties using user interface
- Update pad
Run the following example by $ python2 -i example.py
import ROOT
import mag
# setting up data samples
# mag.arr() function uses for setting up a double type to numbers in sample list
x1 = mag.arr(range(100))
x2 = mag.arr(map(lambda i: i/5., range(500)))
y1 = mag.arr(map(lambda i: i**0.5, x1))
y2 = mag.arr(map(lambda i: ROOT.TMath.Sin(i), x2))
c = ROOT.TCanvas()
# create graphs from data samples & setting up some properties
gr1 = ROOT.TGraph(len(x1), x1, y1)
gr1.SetTitle("y = #sqrt{x}")
gr1.SetLineWidth(2)
gr2 = ROOT.TGraph(len(x2), x2, y2)
gr2.SetTitle("y = sin(x)")
gr2.SetLineWidth(2)
gr2.SetLineColor(ROOT.kBlue)
# create MultiAxisGraph object
MAG = mag.MultiAxisGraph()
# adding graphs to mag object
# mode "right" means, that graph will be scaled and represented with right axis
MAG.AddGraph(gr1)
MAG.AddGraph(gr2, mode="right")
# draw the mag object
MAG.Draw()
# accses to multigraph object in mag for setting style and attributes
mlt_graph = MAG.GetMultigraph()
mlt_graph.GetYaxis().SetTitle("axis for #sqrt{x} graph")
mlt_graph.GetXaxis().SetTitle("x")
# accses to rigth axis for setting it's attributes
rigth_axis = MAG.GetRightAxis()
rigth_axis.SetTitle("axis for sin(x) graph")
rigth_axis.SetLineColor(ROOT.kBlue)
rigth_axis.SetLabelFont(42)
rigth_axis.SetTitleFont(42)
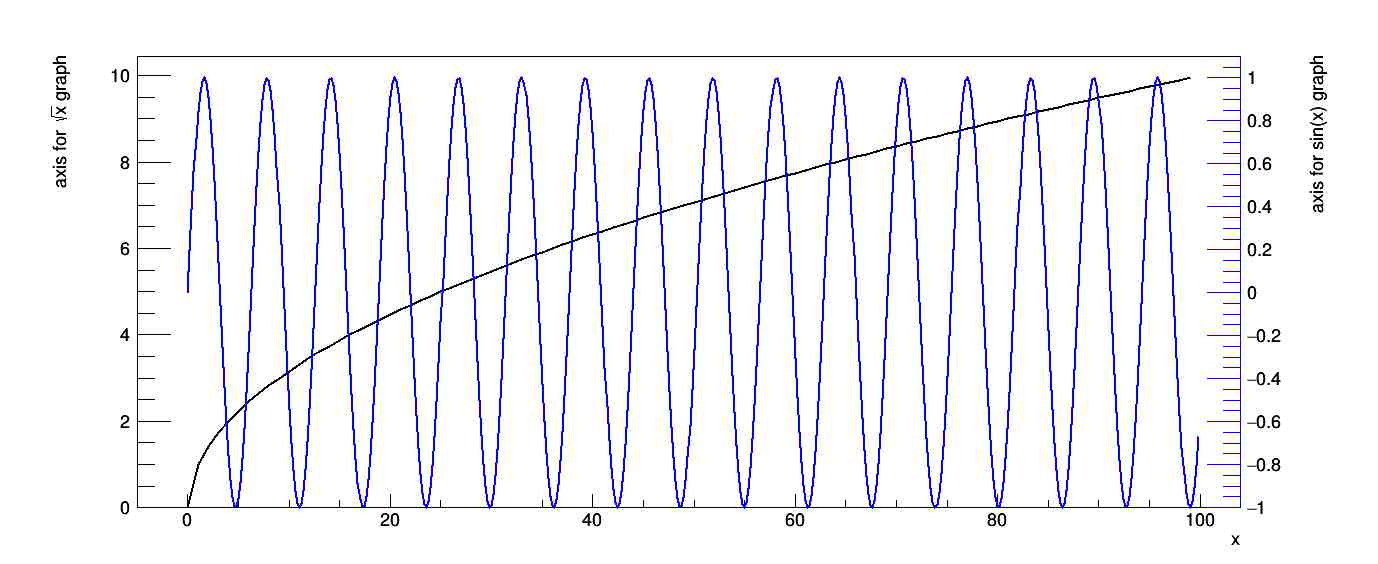
# update the canvas so changes is applied
c.Update()After executing example you will get the canvas:
| Function name | Description |
|---|---|
| GetMultigraph( ) | Returns multigraph object of MAG |
| GetBaseGraphs( ) | Returns a list of "base" TGraph objects (not scaled) |
| GetRightGraphs( ) | Returns a list of TGraphs, that not scaled and asociated with right axis |
| GetLeftGraphs( ) | Returns a list of TGraphs, that that not scaled and asociated with left additional axis |
| GetRightAxis( ) | Returns rigth axis - TGaxis object |
| AddGraph(TGraph gr, str mode ) | Add TGraph g and asociate it with axis by mode ("base", "right", "left") |
| Draw( ) | Scale and draw graphs (TGraphs in TMultiGraph) and axises in current TPad |
| Update( ) | Redraw graphs and axises |
The class is under GPL v3 License