This is a JavaScript app (right now just a single page) that will take a set of images and draw them on a canvas according to the coordinates given for the top left, and bottom right corners of each image.
Useful if you have a load of partial images and want to see them all together in their proper positions relative to eachother.
Suppose you have a set of image tiles that represent data taken in a parameter space. For example, we have collected data in a 2D region of x and y, and at each coordinate we have a value z. This can be represented as an image.
Now say you have N of these which are taken at different x and y regions and you want to assemble them all to get a view of the full 2D space.
The script has an array of filenames, which are in the format
(image_)<xmin>,<ymin>,<xmax>,<ymax>.png
where the preceeding image_ part is optional.
each of these is loaded and drawn on the canvas so that it covers the area specified by the coordinates.
Limits are currently set up to display -400 to 0 along x, and 970 to 976 along y. It will work outside of these ranges, but was optimised for these sorts of values so might not look very good elsewhere.
To add a new image to the example page, just add the filename to the list of showimages.html and use this straight away.
Include the library DataTiler.js and and do as in lib.html:
Make a default view port as a DataTiler.Rectangle object (A rectangle describing the limits of the visible area)
var viewPort = new DataTiler.Rectangle();
	viewPort.x = -450;
	viewPort.y = 969.7;
	viewPort.width = (-200 - viewPort.x);
	viewPort.height = (974 - viewPort.y);
a list of file uris
var imageFileNames = ["image_-500.00,964.06,-100.00,986.19.png",
...
						  "image_-290.00,973.53,-180.00,973.94.png"];
and a canvas object
var canvas = document.getElementById("drawing");
Then finally make a new DataTiler object, passing it these three things.
var dt = new DataTiler(canvas, viewPort, imageFileNames);
That's it!
In the basic showimage.html file, a checkbox is generated for each image. The corresponding image is only drawn if its checkbox is checked. The checkbox lights up when the image is moused over in the canvas. This isn't implemented in the library. Instead the ImageArray object of the DataTiler stores many DataTiler.Image objects, each of which represents an image, with its bounding box and visibility. The visibility should be toggled to implement a similar feature.
Click and drag to move the view port through the space.
Scroll up/down to zoom out/in.
Up/down/left/right keys move the view port accordingly.
The images in the root folder are parts of a data set that look like
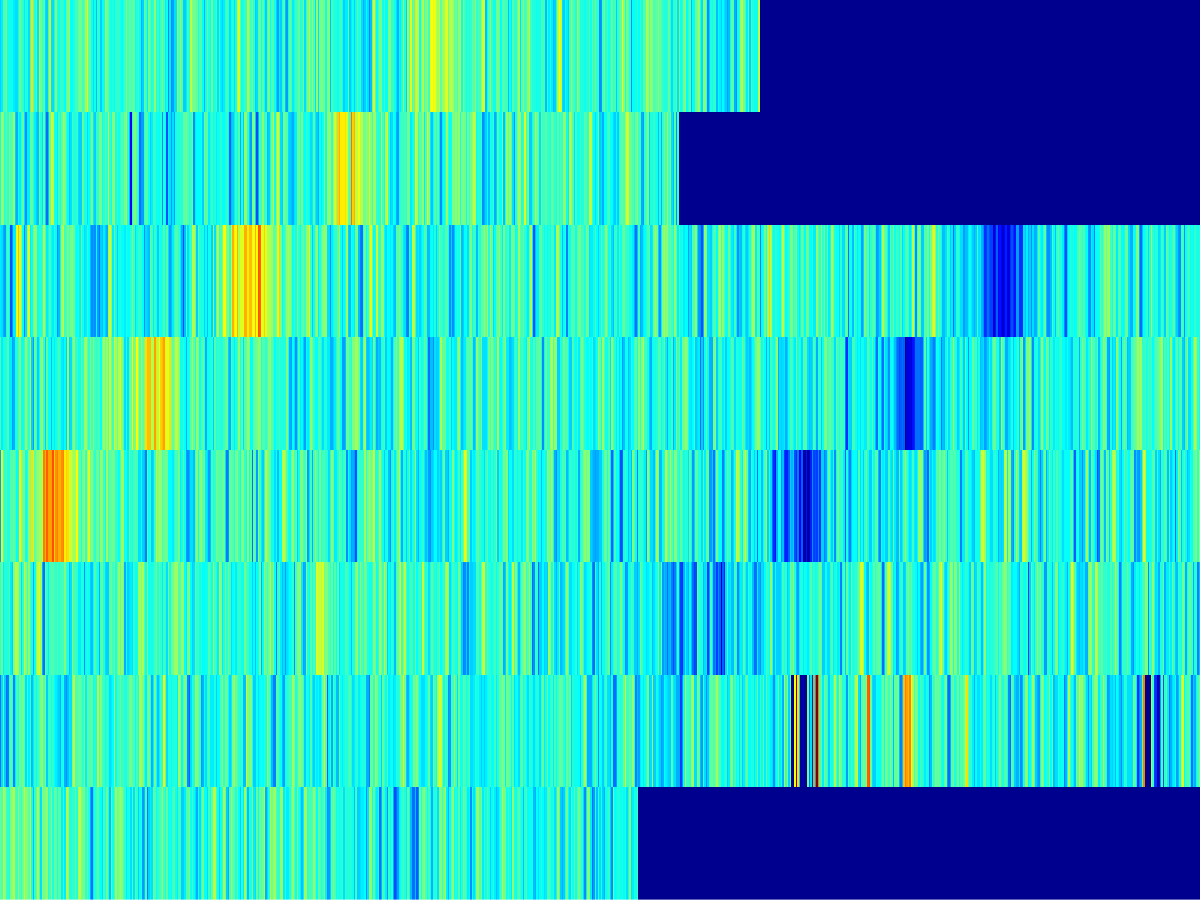
which has top left coordinates (-260,973.7) and bottom right coordinates (-100,973.84), and
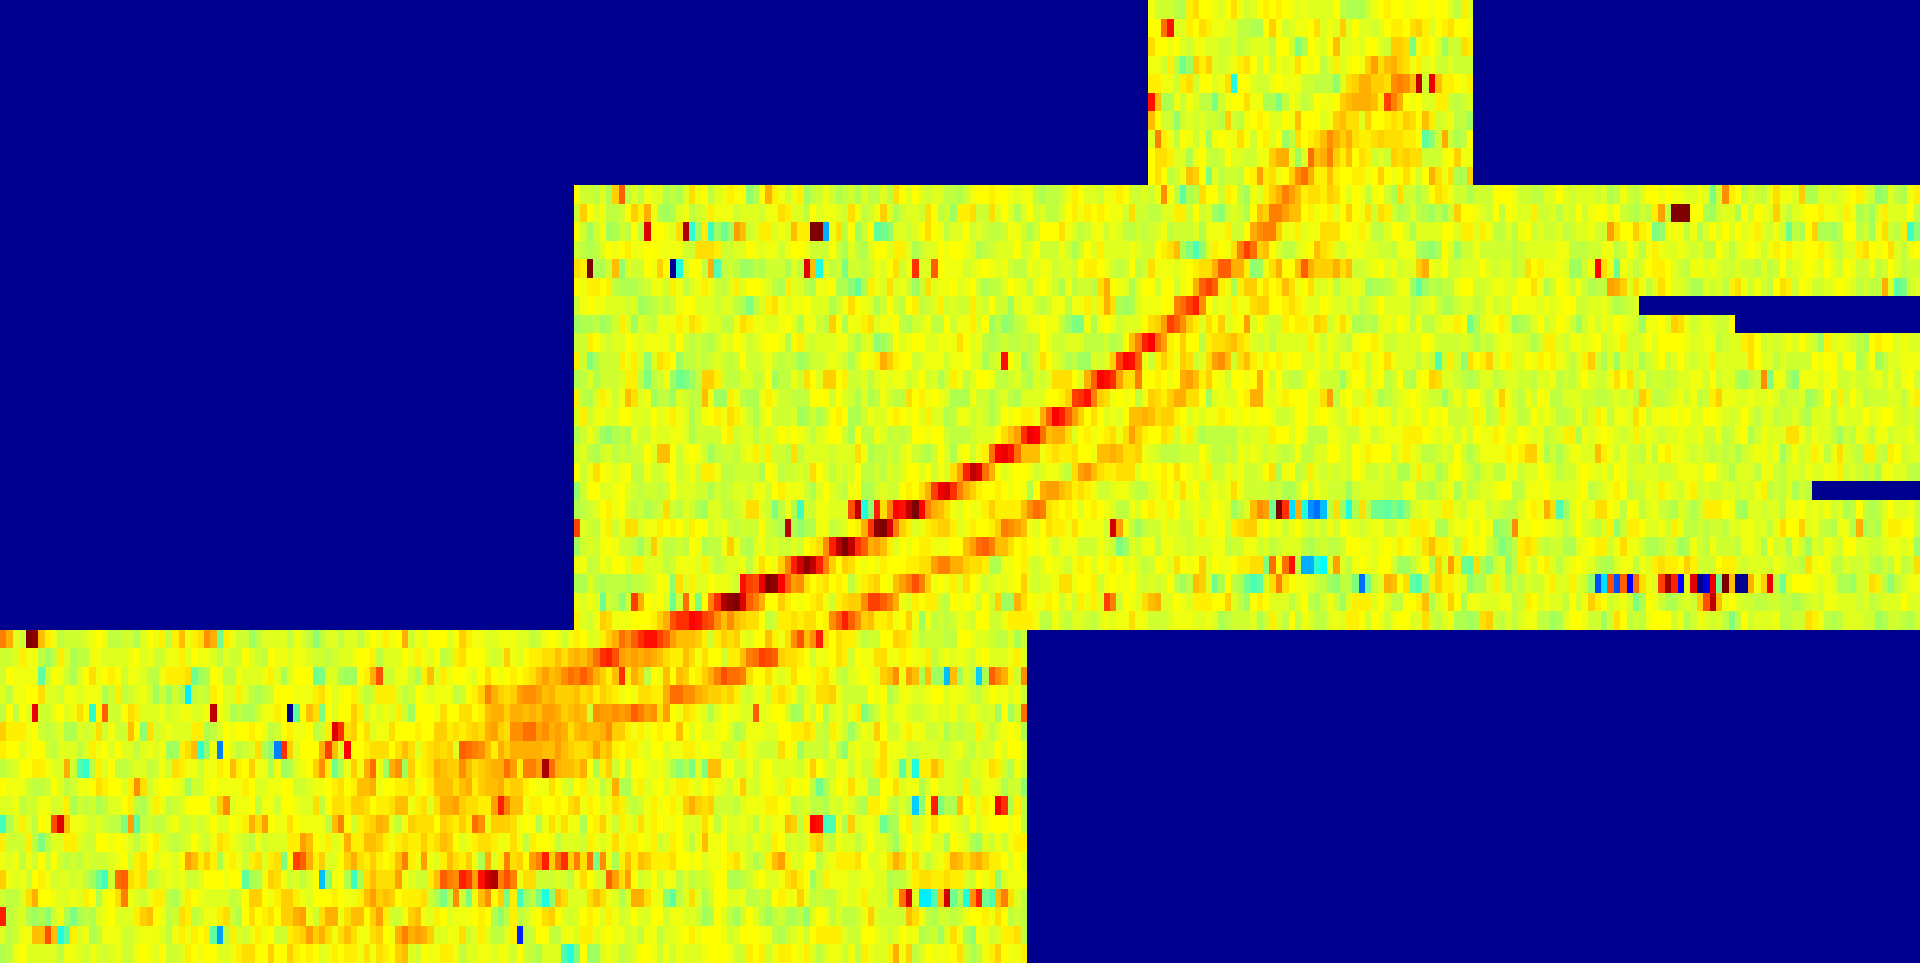
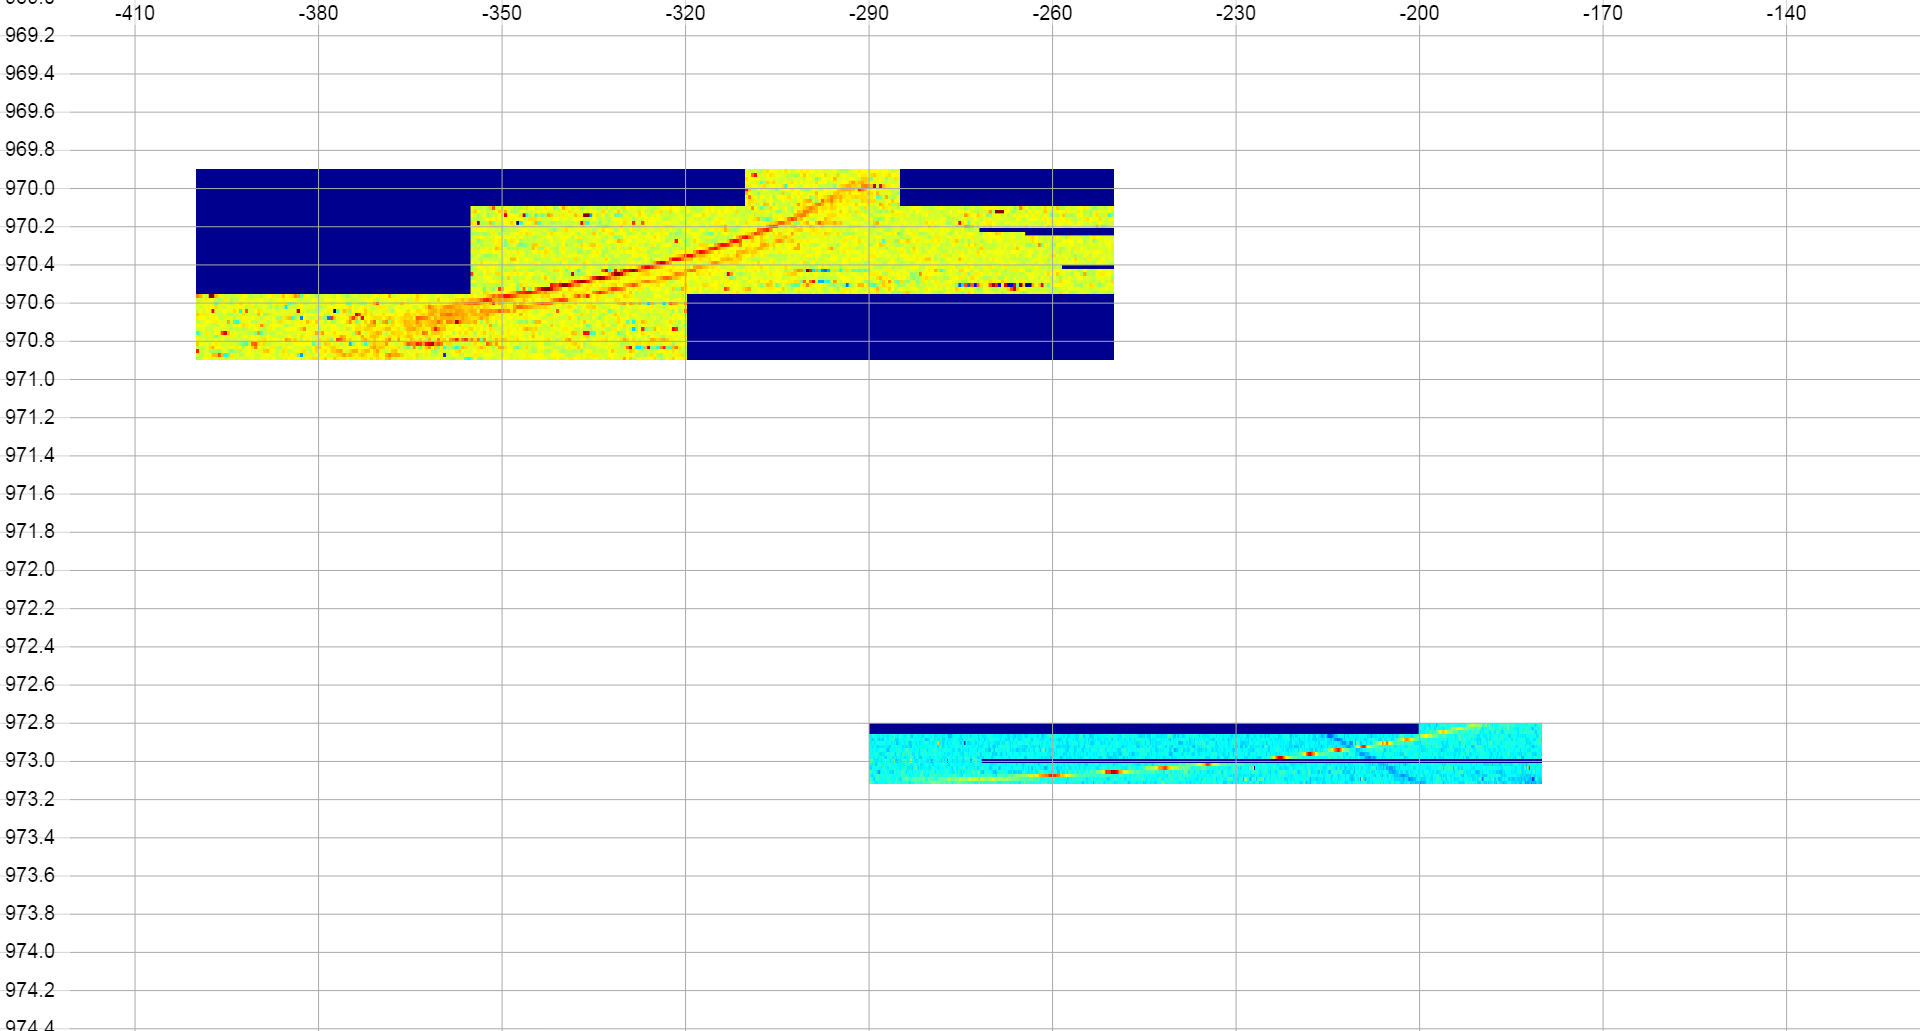
which has top left coordinates (-400,969.9) and bottom right coordinates (-250,970.9). These would be assembled on the canvas to look like:
Uses RequireJS (http://requirejs.org/)
Also uses arian's png library, pngjs (https://github.com/arian/pngjs) with a few modifications; encapsulated to work with RequireJS (although zlib isn't included so can't decompress image data); added reading of tEXt chunks in the png image which are made publicly available.
The reason for including pngjs is so the coordinate information can be stored in a tEXt chuck in the png rather than in an ugly filename. Coming soon..