#TidyTuesday is a weekly data challenge aimed at the R community. Every week a new dataset is posted alongside a chart or article related to that dataset, and ask participants explore the data. You can access the data and find out more on GitHub.
My contributions can be found on GitHub, and you can use this Shiny app to explore my visualisations with links to code for each individual plot. You can also follow my attempts on Mastodon at fosstodon.org/@nrennie.
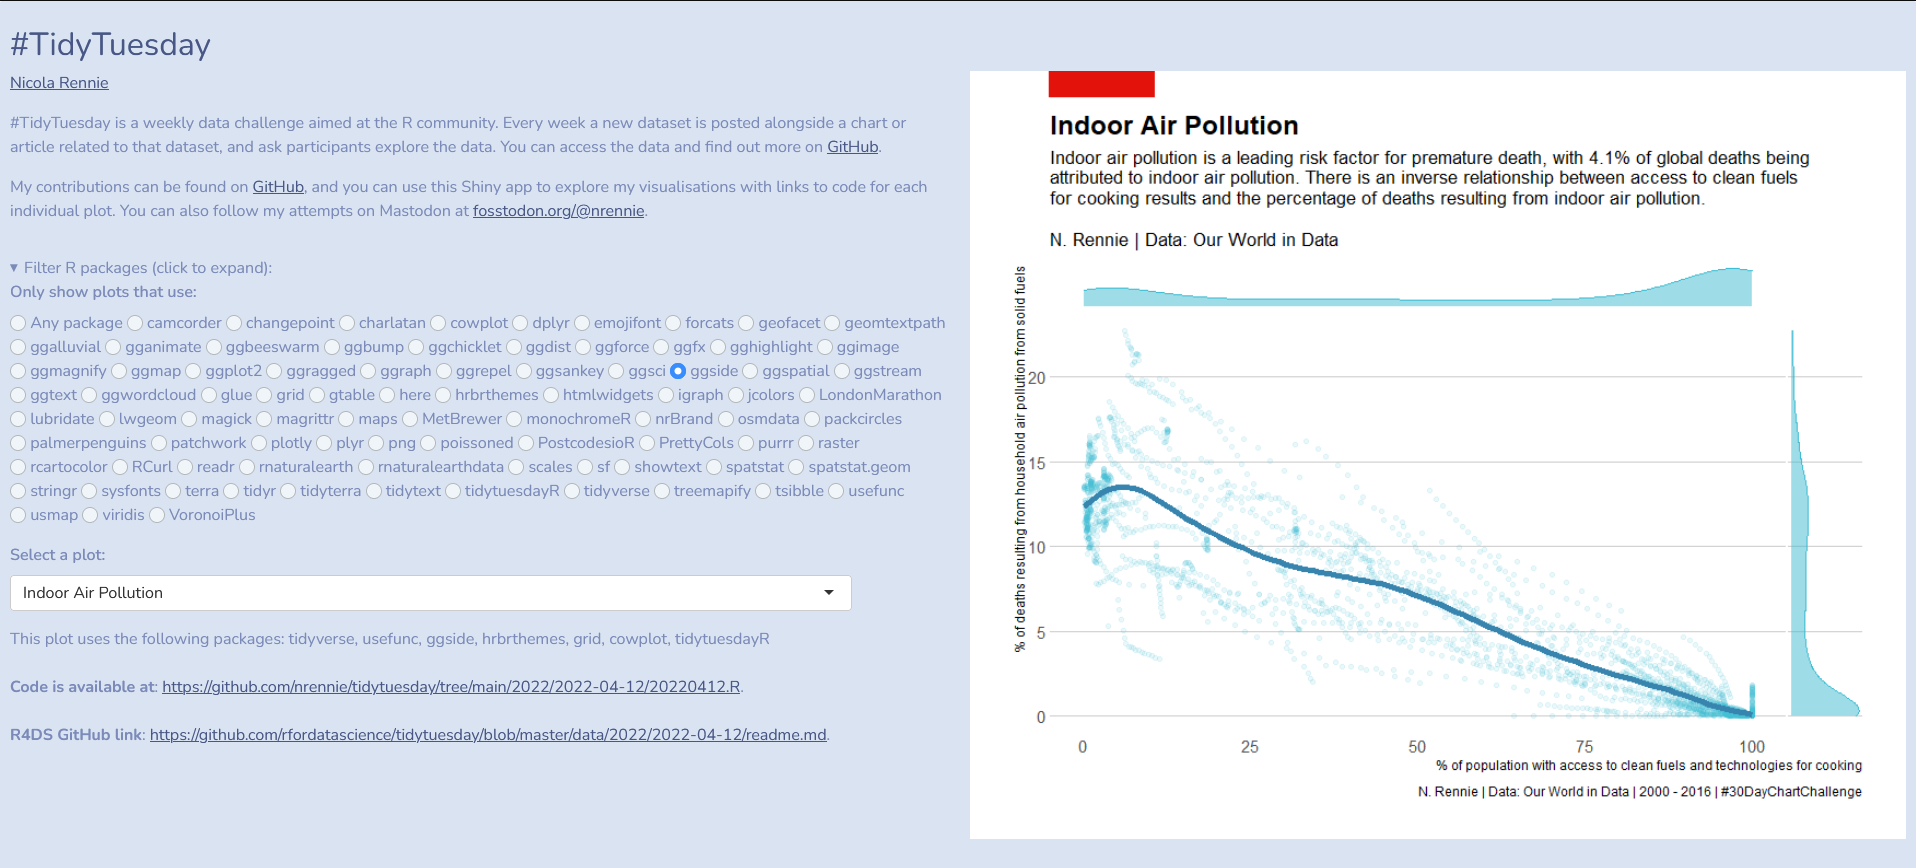
This Shiny app allows you to display and explore my #TidyTuesday plots, and allows a you to see examples that use specific packages. Links to the original #TidyTuesday data alongside links to code scripts on GitHub are provided. A list of packages found in each script is provided.
This Shiny app is deployed via GitHub pages using shinylive with webR. See Rami Krispin's tutorial for details on how to deploy your own R Shiny app using shinylive.
A couple of small gotchas:
- I had to load external data using
load(url("url_to_file/file.RData")). - Not all packages (including
shinythemes) are supported so not all parts of the original (non-shinylive) app could be directly transported over. - When viewing the app with some of these bugs in it, it simply returned a
404 Not founderror. Using the shinylive editor mode was really helpful.
Find a bug? Report as a GitHub issue.
