Releases: nhn/tui.chart
v4.0.3
v3.11.3
bugfixes
- Fixed a bug where tickInterval auto did not work properly in the line chart when there is no initial data and when data is defined with setData afterwards
- Add custom tooltip data
colorinformation - Fixed a bug where data labels were not exposed when using line chart null data
v4.0.2
v4.0.1
🎊 TOAST UI Chart 4.0 is here! 🎊
TOAST UI Chart v3 was developed based on svg and raphael.js. We supported and were loved by a wide range of browsers from IE8 to more modern browsers. However, as time passed, raphael.js stopped updating, and we needed to find a new solution to continue building the Chart. TOAST UI Chart team removed all of the dependencies and rebuilt the entire product based on canvas from scratch in order to make the Chart lighter.
As we kick off the new year 2021, we would like to introduce the brand-new TOAST UI Chart. Now, let's take a look at each and every change!
👀 What's new?
📌 Lighter Chart
TOAST UI Chart v4.0 removed all of the dependencies including raphael.js and TOAST UI Code Snippet and replaced it with our own reactive system.
Furthermore, with the ESM build support, users can pick out the charts as necessary and use the Chart more efficiently.
📌 Features Made Easier
responsive
The responsive option allows users to define chart options according to the changes in the chart's width or height and even manage the animation play speed.
const options = {
  ...
  responsive: {
    animation: { duration: 300 },
    rules: [
      {
        condition: ({ width, height }) => {
          // Apply the following options when the width is below 500px and the height is below 400px.
          return w <= 500 && h <= 400;
        },
        options: {
          chart: { title: '' },
          legend: {
            visible: false
          },
          exportMenu: {
            visible: false
          }
        }
      }
    ]
  }
};
Users can use this option to change the position of the legend, change the interval between ticks or labels, and much more custom options according to the size of the chart rendered.
Live Update
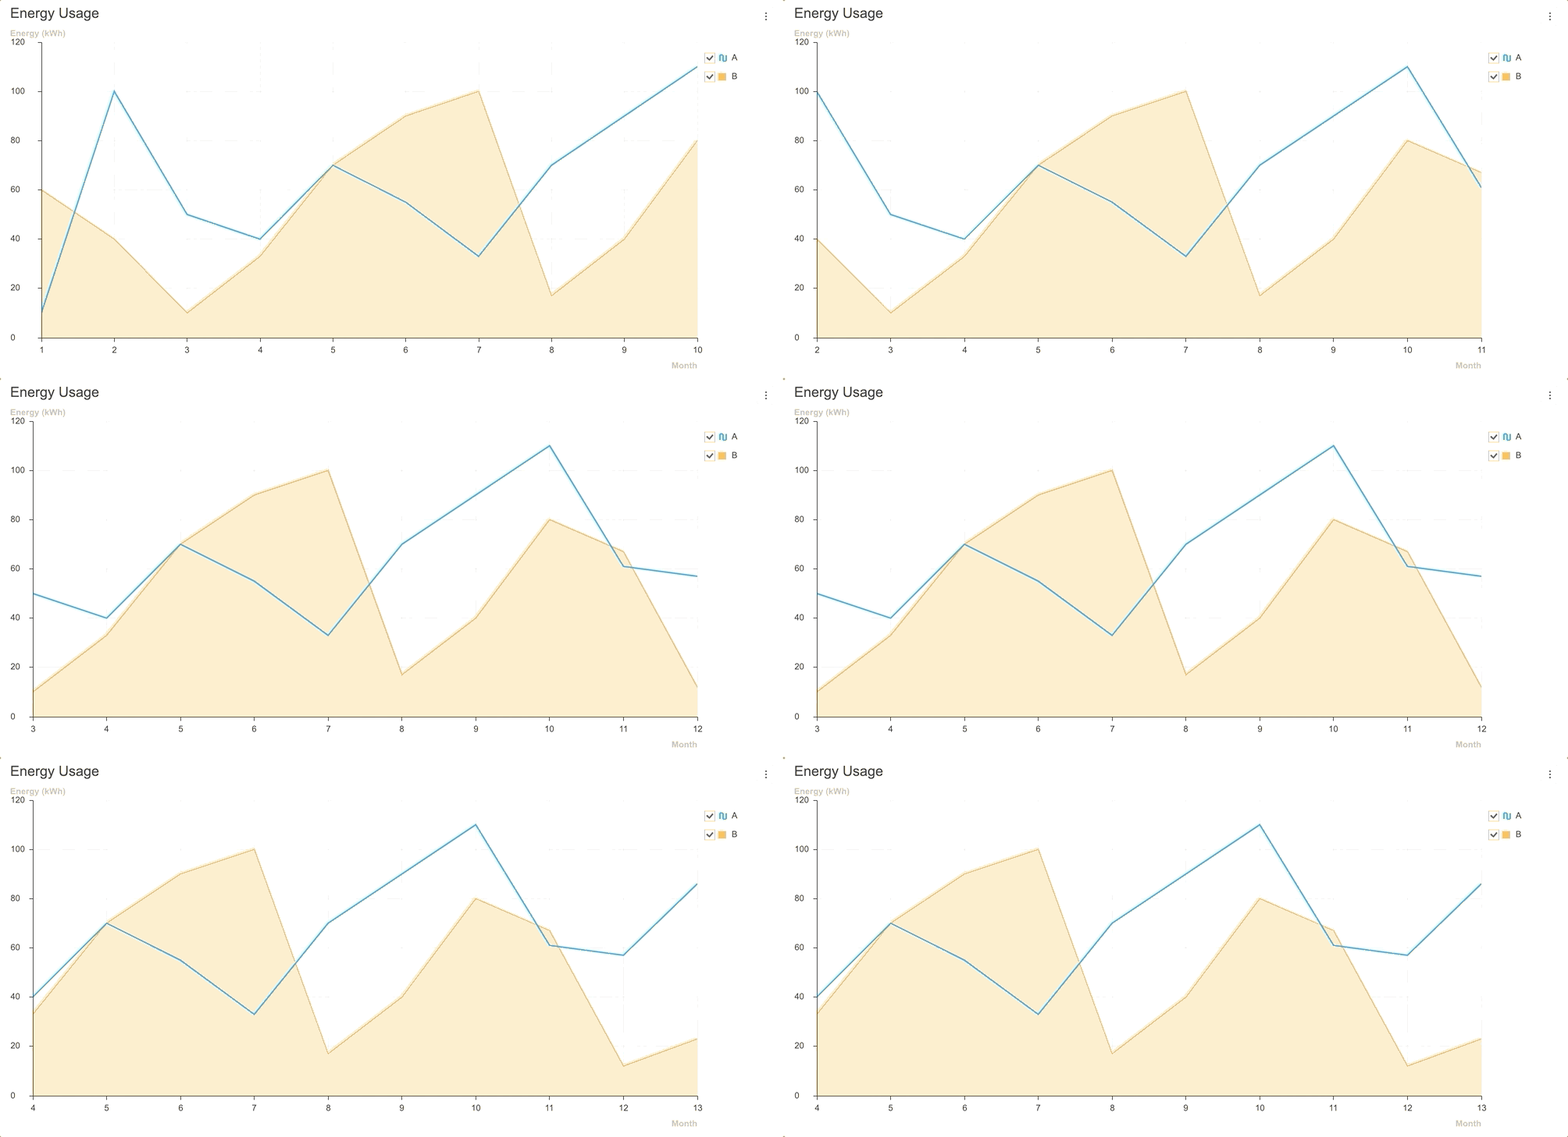
Live Update feature can be used to update the chart according to the chart's size when new data is added in real time. The feature that was only supported with Line Chart in TOAST UI Chart v3.x is now supported with Area, Line, Heatmap, LineArea, Column, and ColumnLine charts.
| Area | Line | Heatmap |
|---|---|---|
 |
 |
 |
| LineArea | Column | ColumnLine |
|---|---|---|
 |
 |
 |
Use the Live Update features to make your data come to life!
Even More Themes and Layout Configurations
In order to make the charts blend into the styles of users' services, we are offering a wider variety of theme options than we did with v3.x. Users now have the ability to change styles like color, width, format not only for the series but also for other components like axes, legends, plots, and more!
Additionally, users can control not only the size of the entire chart but also the widths and heights of specific components in order to make the chart's layout more suitable for the page.
const options = {
  xAxis: {
    width: 700,
    height: 100
  },
  yAxis: {
    width: 100,
    height: 350,
  },
  legned: {
    width: 200
  }
};
Use the themes and layout options to customize your charts!
📌 Easier Development
TOAST UI Chart v4.0 is written in TypeScript and is of the Mono-repo format that uses Lerna. Any developer who wishes to contribute to the TOAST UI Chart can understand the code through types and due to the fact that there are multiple Github issues in a single repository.
✈️ Migration Guide
Are you already using TOAST UI Chart v3.x? Then we have put together a migration guide just for you. Check out the changes by stages and apply them!
v3.11.2
Bugfixes
- Apply Heatmap border color, width theme option(#292)
- Apply Legend label color on spectrumLegend theme option(#292)
var theme = {
    series: {
        startColor: '#ffefef',
        endColor: '#ac4142',
        borderColor: '#fff', // heatmap border color
        borderWidth: 2 // heatmap border width
    },
    legend: {
        label: {
            color: 'blue' // heatmap / treemap spectrum font color
        }
    }
};v3.11.1
v3.11.0
Features
- column chart connector(#279)
- deprecate
stackTypeoption - add new
stackoption
- deprecate
const options = {
  series: {
    stack: 'normal' | 'percent',
    // or
    stack: {
      type: 'normal' | 'percent',
      connector: boolean,  // default: false
      // or
      connector: {
        type: 'solid' | 'dotted', // default: solid
        color: string, // default: #aaa
        width: number // default: 1
      }
    }
  }
}
Enhancement
- Change the order of stack column chart legend (#279)
v3.10.2
v3.10.1
Enhancement
- remove babel-polyfill, use core-js directly(#263)
| file name | before size | after size | variance | etc |
|---|---|---|---|---|
| tui-chart.js | 1.61MB | 1.65MB | 40KB |
include tui.code-snippet |
| tui-chart-polyfill.js | 1.88MB | 1.73MB | 160KB |
use core-js directly |
| tui-chart-all.js | 2.09MB | 1.82MB | 270KB |
decrease code-snippet size 70KB |
Bugfixes
v3.10.0
Features
destroyAPI- Destroys the chart instance.
var chart = new LineChart({ ... });

chart.destroy();
Enhancement
- add series animation duration options(#203)
- except
radial,map,box, dynamically line type chart - default:
true
- except
const options = {
  series: {
    animation: false
  }
}
// or

const options = {
  series: {
    animation: {
      duration: 0 // number
    }
  }
}- add animation parameter to setData
chart.setData(rawData, false); // off animation
chart.setData(rawData, {duration: 1000}); // set animation duration- Improving tooltip(#255)
- reduce tooltip animation duration
- Fixed event detection on tooltips
- Change bound area from 50 to chart tick interval
Bugfixes
- Fixed that YAxis is moved when set rotateLabel false(#245)


