Reports the resource usage of Docker containers to InfluxDB
pip install pyyaml influxdbAlso you need to have created a InfluxDB database already, this code does not create the database for you.
python report.py For continous reporting with 5 seconds interval:
watch python report.pyEdit the config.yaml file to config your InfluxDB parameters and Docker Remote API endpoint. Currently, Unix socket binded Docker remote API is not tried.
docker:
    api: "http://localhost:4500"
influxdb:
    host: localhost
    user: root
    password: root
    port: 8086
database: dockerThe metrics are stored in the given database as: HOST.CONTAINERID.cpu, HOST.CONTAINERID.memory, HOST.CONTAINERID.disk.bytes, HOST.CONTAINERID.disk.counts . This is the recommended way in the InfluxDB documentation, storing the host & containerid as a row is also possible but seems to be slow. Although, you are free to modify the code to suit your needs.
SELECT rss FROM /.*memory/ GROUP BY time(15s)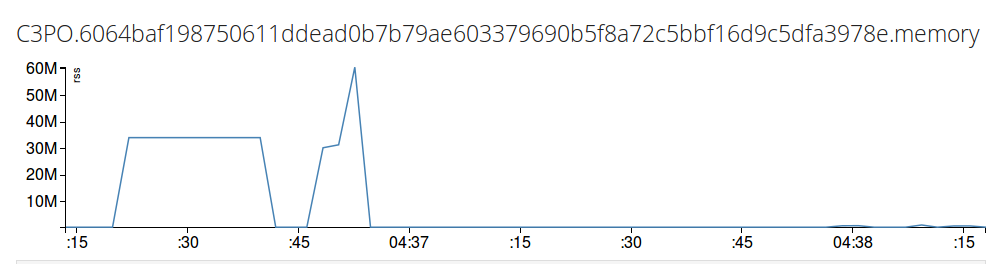
SELECT derivative(Total) FROM /.*cpu/ GROUP BY time(5s) 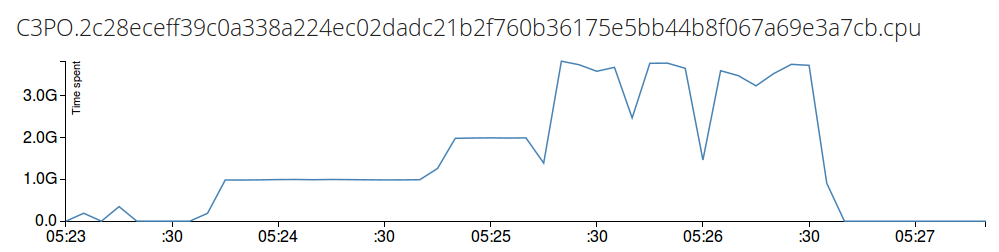
Note: I run a 4 core VM under VirtualBox, 1G means = 1 second, I run sysbench --test=cpu --cpu-max-prime=50000 --num-threads=1 then canceled it and run it with 2, 4 and 32 threads to show that 2G means 2 second consumed in total, and 4G means 4 second consumed, and if we have more threads the performance drops a little because of switching cost, it is not full 4G. Anyways, it should indicate the total time spend in each core. If you want to query the individual cores, you can use CPU0, CPU1, ... CPU(N-1) on your depending on core number of your machine.
SELECT Derivative(Total) FROM /.*disk.bytes/ GROUP BY time(5s)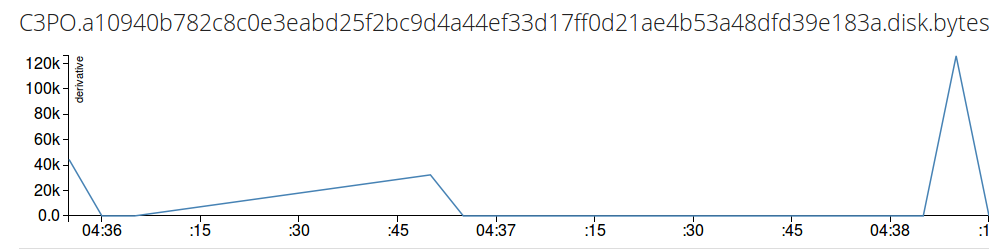
SELECT Async FROM /.*disk.count/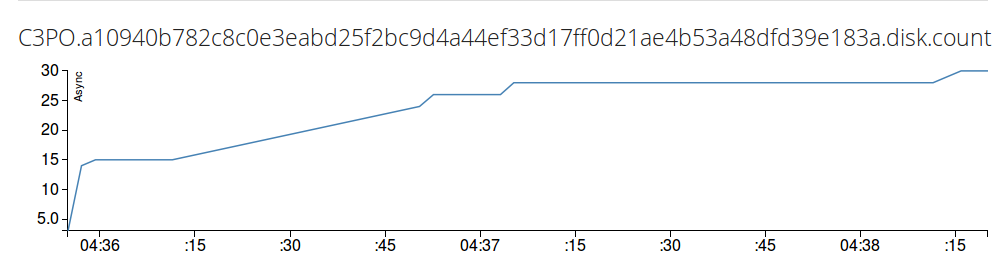
Note: It is the sum of values, not the speed. If you want speed, you have to take the derivative of the values by derivative() operator.
- A nice UI that repeats the queries over time and plots them in a nicer way.