This project offers a streamlined Python script that facilitates sending ICMP echo requests (commonly known as ping) to multiple network devices and subsequently stores the results in a simple database. Its primary aim is to monitor the online status of hospital devices, enabling the identification of devices that can be safely powered down during off-hours, ultimately resulting in energy savings.
If you choose to utilize this software, kindly reference the following research paper:
Heye, T., Meyer, M. T., Merkle, E. M., & Vosshenrich, J. (2023). Turn It Off! A Simple Method to Save Energy and CO2 Emissions in a Hospital Setting with Focus on Radiology by Monitoring Nonproductive Energy-consuming Devices. Radiology. https://doi.org/10.1148/radiol.230162
The script relies on the fping utility, which can be easily installed on recent Debian/Ubuntu distributions using:
sudo apt-get install -y fpingor by following the official installation instructions. You might need to set additional file capabilities to run the program as non-root, which can be achieved by issuing the following command on a Linux machine:
sudo setcap cap_net_raw+ep `which fping`To download this script, setup/activate a virtual environment, and install all dependencies, use:
git clone https://github.com/mtmey/ping_tracker.git
cd ping_tracker
python3 -m venv .venv --prompt "ping_tracker_venv"
source .venv/bin/activate
pip install -r requirements.txt
You might need to install python3 (tested on Python 3.9) and Python's venv package.
The script is intended for use on the command line. For an overview of its functionality, use:
python poll.py --helpThe list of hosts to be scanned can either be passed with one (or multiple) plain text files containing one hostname or IP address per line, or as a sqlite3 database with a table named hosts (at least two columns are expected: id with an unique integer id for the host and hostname with the IP address or DNS resolvable hostname).
To check the reachability of the following two hosts, let's consider the following plain text file (test_hosts.txt):
google.com
1.1.1.1
The hosts are queried by issuing:
python poll.py --table --csv=results.csv test_hosts.txtwhich will result in the following output:
            reachable          ts
machine
google.com       True  1673391318
1.1.1.1          True  1673391318

✅ Saved table to results.csv
The contents of results.csv are:
machine,reachable,ts
google.com,True,1673391457
1.1.1.1,True,1673391457
To append results to an existing CSV file, add the --append option to the above command.
The same can also be achieved using a SQLite database (with sqlite3 installed):
sqlite3 test.db "CREATE TABLE IF NOT EXISTS hosts (id INTEGER PRIMARY KEY, hostname TEXT NOT NULL); INSERT INTO hosts (hostname) VALUES ('google.com'), ('1.1.1.1');"
python poll.py --elapsed --sql=test.db
To show the time series data (further polls are automatically appended to the ts table), use:
sqlite3 test.db -column -header "SELECT datetime(timestamp, 'unixepoch', 'localtime') datetime, hostname, online, latency_ms FROM ts INNER JOIN hosts ON hosts.id = ts.host_id;"which will result in something similar to:
datetime             hostname    online      latency_ms
-------------------  ----------  ----------  ----------
2023-01-12 22:24:36  google.com  1           3.54
2023-01-12 22:24:36  1.1.1.1     1           3.45
If you want to check the online status periodically, you may install a cronjob (using crontab -e on Linux) by adding the following line:
*/15 * * * * bash -c "( cd ~/ping_tracker && .venv/bin/python poll.py --elapsed --sql=test.db ) >> ~/ping_tracker.log 2>&1"
This will run the script every 15 minutes (*/15, adjust as needed) and log the script's output to your home folder (into ping_tracker.log). Make sure to set up a virtual Python environment inside the ~/ping_tracker script folder as shown above. The host statuses are recorded inside the ts table of test.db in this example.
This section demonstrates how to set up a live dashboard to display the collected data. We will use Redash, an open-source data visualization platform that is easy to install. Follow the steps shown on their website to install Redash. Alternatively, you can use their setup script on an Ubuntu machine, which will install a dockerized version of Redash:
curl -sL "https://github.com/getredash/setup/raw/master/setup.sh" | bash -To access the ping_tracker database from Redash, you need to mount its directory into the docker container. If your database is stored under ~/ping_tracker/dbs/, you can achieve this by adding a volumes key to the x-redash-service in the /opt/redash/docker-compose.yml file as follows:
x-redash-service: &redash-service
  image: redash/redash:8.0.0.b32245  # or redash/redash:10.1.0.b50633
  depends_on:
    - postgres
    - redis
  env_file: /opt/redash/env
  volumes:  # this is newly added; the rest should remain unchanged and is only shown for context
    - "/etc/timezone:/etc/timezone:ro"  # set the time zone from host machine, see: https://serverfault.com/a/854685
    - "/etc/localtime:/etc/localtime:ro"
    - "$HOME/ping_tracker/dbs/:/opt/dbs/"  # adjust paths as needed
  restart: always
This will also correctly set the local timezone in the docker container. After mounting the relevant directories, you can set up a new Data Source in Redash's settings panel. Select Sqlite as the type of data source and set the Database Path to /opt/dbs/test.db (or similar). Ensure the connection works by clicking the Test Connection button.
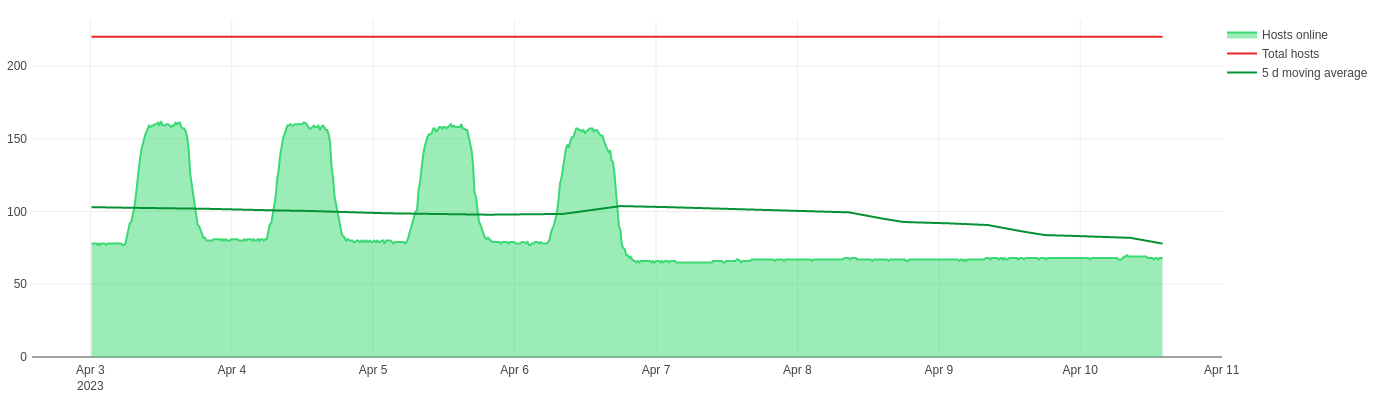
To begin, create a new query using the data source you set up earlier. A simple SQLite query could look like this:
SELECT
  datetime(timestamp, 'unixepoch', 'localtime') datetime,
  sum(online) "Hosts online",
  count(DISTINCT host_id) - sum(online) "Hosts offline",
  count(DISTINCT host_id) "Total hosts",
  avg(sum(online)) OVER (
    ORDER BY timestamp
    ROWS BETWEEN 4 * 24 * 5 PRECEDING AND CURRENT ROW  -- =5d if you collect data every 15 minutes (hence the 4 -> 4 times per hour)
  ) "5 d moving average"
FROM
  ts
  INNER JOIN hosts ON hosts.id = ts.host_id
WHERE
  host_id IN (SELECT host_id FROM ts WHERE online IS NOT NULL GROUP BY host_id)
  AND timestamp BETWEEN strftime('%s', '{{ date_range.start }}', 'utc') AND strftime('%s', '{{ date_range.end }}', 'utc')
GROUP BY
  timestamp
ORDER BY
  timestamp;
This will also create a widget that allows you to select the time range to display (choose widget type Date and Time Range (with seconds)). Using this, you may generate visualizations like the one below:
A sample dashboard we created is shown below:
