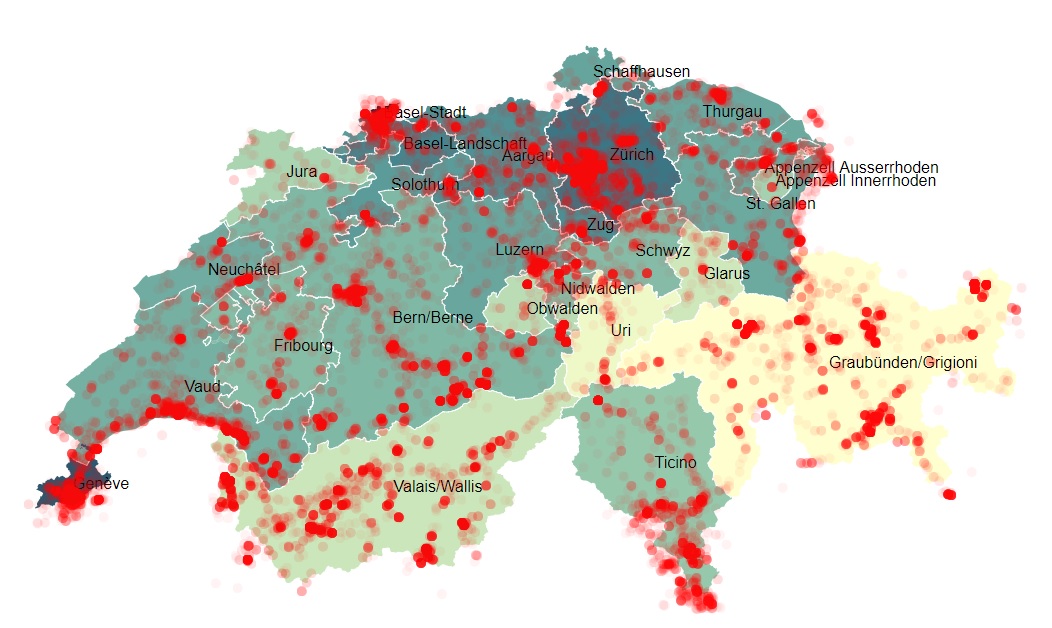
Create a choropleth map of Switzerland using D3JS. Color each canton according to its population density. Display Instagram posts' locations on the map. Details and datasets are in Google Docs.
Open the solution in your browser.
| Name | Name | Last commit message | Last commit date | |
|---|---|---|---|---|
Create a choropleth map of Switzerland using D3JS. Color each canton according to its population density. Display Instagram posts' locations on the map. Details and datasets are in Google Docs.
Open the solution in your browser.