Introduction
Software Components
UI Elements
Desktop Widgets
Web Application
Platform Support
Download
Documentation
Build From Source
Donations
Mining Visualizer is a suite of programs supporting Ethereum mining, with some special features for solo miners. Pool mining is currently not supported.
Of course, solo mining is not for everyone. It is generally only feasible for larger mining operations. For instance, if you only have 1 GPU, at the current level of difficulty the average time to mine a block is somewhere around 750 days! If that's you, you're best to stick with pool mining.
Larger mining operations, though, should definitely consider it. There's no mining fees, it helps to make the network more decentralized and secure, and you get the pride of mining your own blocks!
This software suite is made up of two programs. The first is MVis-ethminer, the actual miner, which is a fork of Genoil's ethminer. The second program is the one contained in this repository, which is referred to as Mining Visualizer proper, or just MVis. It is a data collection / monitoring program written in Pascal that communicates with the miner and drives the desktop widgets and the web application. It would normally run on your desktop computer.
The whole package is free / open source software. No fees.
Mining Visualizer comes with 4 desktop widgets that display various data items that let you monitor your mining operation at a glance. These are powered by Rainmeter for Windows, and GeekTool for the Mac. (Desktop widgets are possible under Linux using a program called Conky, but no development work has been done in this regard). Most of the items are pretty self explanatory, but I will comment on a few.

- Hash faults: the total number of hash faults that have been reported from your mining farm over the last 24 hours. This line will display in Yellow if any of your miners has exceeded the user defined hash fault limit. The miner is a fork of Genoil's ethminer, and it checks for hash faults much more often then Genoil's did (1 hash check per kernel run), so don't be surprised if the numbers seem high. This will give you an early indicator if one of your GPUs is failing, or you're pushing it too hard with overclocking.
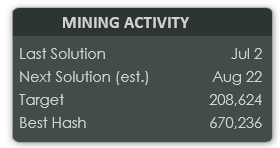
- Last Solution - the last time you mined a block
- Next Solution - an estimate of when you will mine your next block, based on your current hash rate and the network difficulty. Remember, though, there is no guarantee that you will mine a block by this time. The computation of hashes (mining) is a completely random process. It is like rolling a dice. Variance will affect your mining results. Sometimes you will mine a block sooner, sometimes later.
- Target - the upper 64 bits of the current network Target. If your miner finds a hash value lower than the target, you will become the miner of the next block, and receive the appropriate reward.
- Best Hash: the upper 64 bits of the best hash found by your mining rigs, since you last mined a block. Remember, lower is better.

- Balance - Of course, mining a block is the big, exciting event that every solo miner waits for, due to the accompanying mining reward, so Mining Visualizer makes this stand out as much as possible. This line displays the current balance of your mining account. It will cycle through one of five colors every time you mine a block to give you an easy-to-see, visual indicator of this momentous event. You can customize the colors, or even disable it if you think it's too tacky.
The idea behind Close Hits is to record instances where you almost mined a block. The miner keeps track of hashes computed that are within a certain range of the Target value, and reports them as close hits. The desktop widget shows the last 5 close hits found by your mining farm, with an accompanying bar graph. Close hits are also displayed in the Web App graph page. Smaller values are better. For me personally as a solo miner, this feature really helps to keep me engaged and hopeful as I wait for the next mined block.

MVis comes with a 3 page web application to display information pertaining to your mining operation. There is some overlap between this and the desktop widgets, but the web app generally shows more detail.

- This shows Solutions, Close Hits and Work Units.
- Work Units are the same idea as Close Hits, except with a much lower level of difficulty. You could also compare them to shares (from pool mining), except there is no reward when you find one. Their purpose is simply to give you a way to verify that your mining rigs are performing as they should.
- Close Hits are graphed individually, whereas Work Units are grouped into 4 hour intervals and displayed as a histogram.

- This allows you to see a scatter plot of real-time, selected hash values from your miner.
- The purpose of this feature is part educational (a nice visual representation of what miners actually do), part psychological (provides reassurance that the miner is still working and hasn't locked up or frozen), and also just because I thought it would look pretty cool!
- The hashes are scaled down to values between 0.0 and 1.0.
- The Current Target value (similarly scaled) is shown for reference.

- Mining Visualizer : Windows, Linux, OS X
- MVis-ethminer : Windows, Linux
For the latest binaries, please visit the Mining Visualizer Release page, and the MVis-ethminer Release page.
Full documentation is available in the wiki for this repo, including instructions to install and setup this software.
- Clone the repository.
- Download and install Lazarus Pascal.
- Launch the Lazarus Pascal IDE and use it to open
MiningVisualizer.lpi. - Select Run / Compile from the menu.
- You can also build from the command line if you wish. See the scripts in the Build folder for ideas.
Donations will be gratefully accepted at the following addresses:
- mining-visualizer.eth
- 0xA804e933301AA2C919D3a9834082Cddda877C205 (ETH)
- 0x29224Be72851D7Bad619f64c2E51E8Ca5Ba1094b (ETC)