![]()
Last updated: 14-08-2023 for Round 1 2023-2024 Scenarios.
Even the best models of infectious disease transmission struggle to give accurate forecasts at time scales greater than 3-4 weeks due to unpredictable drivers like changing policy environments, behavior change, development of new control measures, and stochastic events. However, policy decisions around the course of infectious diseases, particularly emerging and seasonal infections, often require projections in the time frame of months. The goal of long-term projections is to compare outbreak trajectories under different scenarios, as opposed to offering a specific, unconditional estimate of what “will” happen. As such, long-term projections can guide longer-term decision-making while short-term forecasts are more useful for situational awareness and guiding immediate response.
We have specified a set of scenarios and target outcomes to allow alignment of model projections for collective insights. Scenarios have been designed in consultation with academic modeling teams and government agencies (e.g., CDC).
The Flu Scenario Modeling Hub is open to any team willing to provide projections at the right temporal and spatial scales, with minimal gatekeeping. We only require that participating teams share point estimates and uncertainty bounds, along with a short model description and answers to a list of key questions about design. A major output of the projection hub is ensemble estimates of epidemic outcomes (e.g., infection, hospitalizations, and deaths), for different time points, intervention scenarios, and US jurisdictions.
Those interested to participate, please read the README file and email us at scenariohub@midasnetwork.us .
Model projections should be submitted via pull request to the data-processed folder of this GitHub repository. Technical instructions for submission and required file formats can be found here.
Round 1 2023-2024 will provide early season projections for the 2023-24 influenza season and resemble what we did last year in Round 1 2022-2023 at a time when flu activity was low. This year however, we have an extra year of HHS Protect hospitalization data for calibration. We will consider 6 scenarios describing the interaction of vaccination coverage (first dimension) with the dominant influenza A subtype (second dimension) over a 39-week period, running Sun Sep 3, 2023 to Sat June 1, 2024. We follow a 3 * 2 structure:
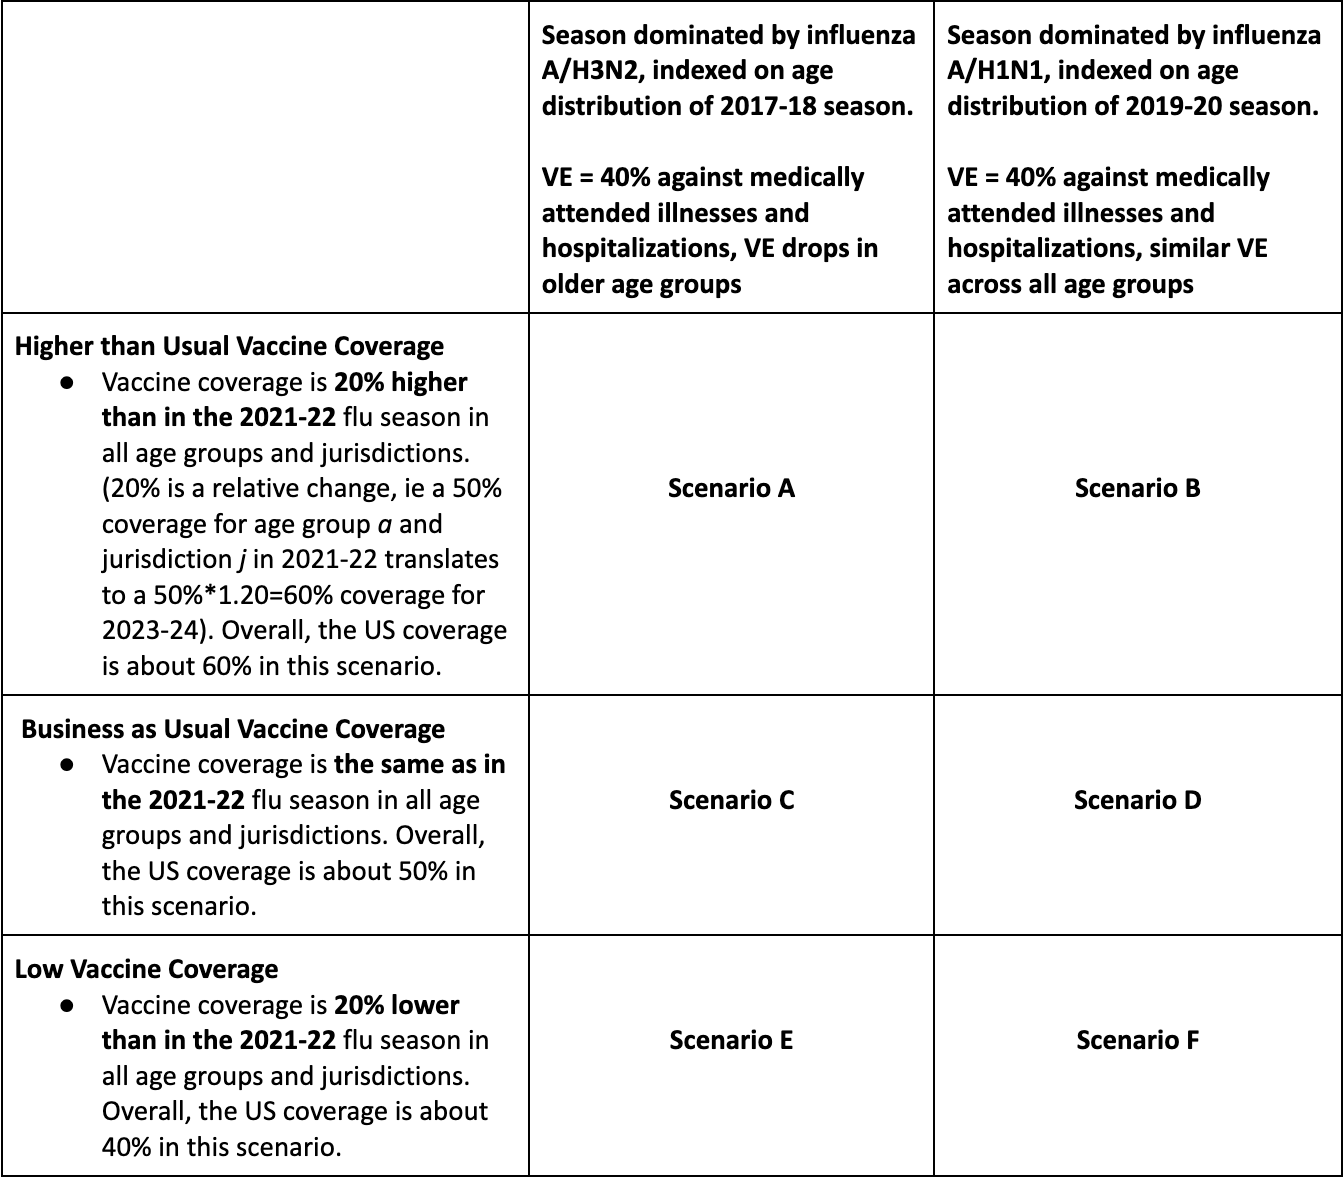
Assumptions regarding influenza subtype dominance, severity and age dynamics: We will index the age dynamics and severity of the next flu season based on two recent exemplar seasons dominated by A/H3N3 (2017-18) and A/H1N1 (2019-20). The timing of the projected 2023-24 season could vary and shouldn’t be purely based on the dynamics of the exemplar seasons. In other words, teams can project early epidemics if model assumptions lead to that, for instance because of prior immunity, seeding or contact assumptions. The burden and age distribution of disease is what we’re after with these illustrative past seasons.
-
The three scenarios assuming A/H3N2 dominance (A, C, E) are based on epidemiologic patterns observed during the 2017-2018 season. Teams should use data from this season (including but not limited to ILI, % positive for influenza, FluSurv-NET hospitalizations) to estimate Re at the start of the season and the % of hospitalizations in the different age groups. Around 65% of observed hospitalizations were among seniors and 6% were in children. https://www.cdc.gov/flu/about/burden/2017-2018.htm
-
The three scenarios assuming A/H1N1 dominance (B, D, F) are based on the 2019-2020 season. Similarly, the overall burden and % of hospitalizations in the different age groups should be based on data from this season. During the 2019-20 epidemic, around 40% of observed hospitalizations were among seniors and around 15% of hospitalizations were observed in children. We will ignore the potential effect of COVID-19 at the very tail end of the 2019-20 season.
https://www.cdc.gov/flu/about/burden/2019-2020.html
Note that both exemplar seasons had some amount of influenza B activity, which c an be ignored (ie, accounting for influenza B activity is at teams’ discretion).
Age-specific data on estimated illnesses, hospitalizations and deaths are provided here for the 2017-18 and 2019-20 seasons:
- https://www.cdc.gov/flu/about/burden/2017-2018.htm
- https://www.cdc.gov/flu/about/burden/2019-2020.html
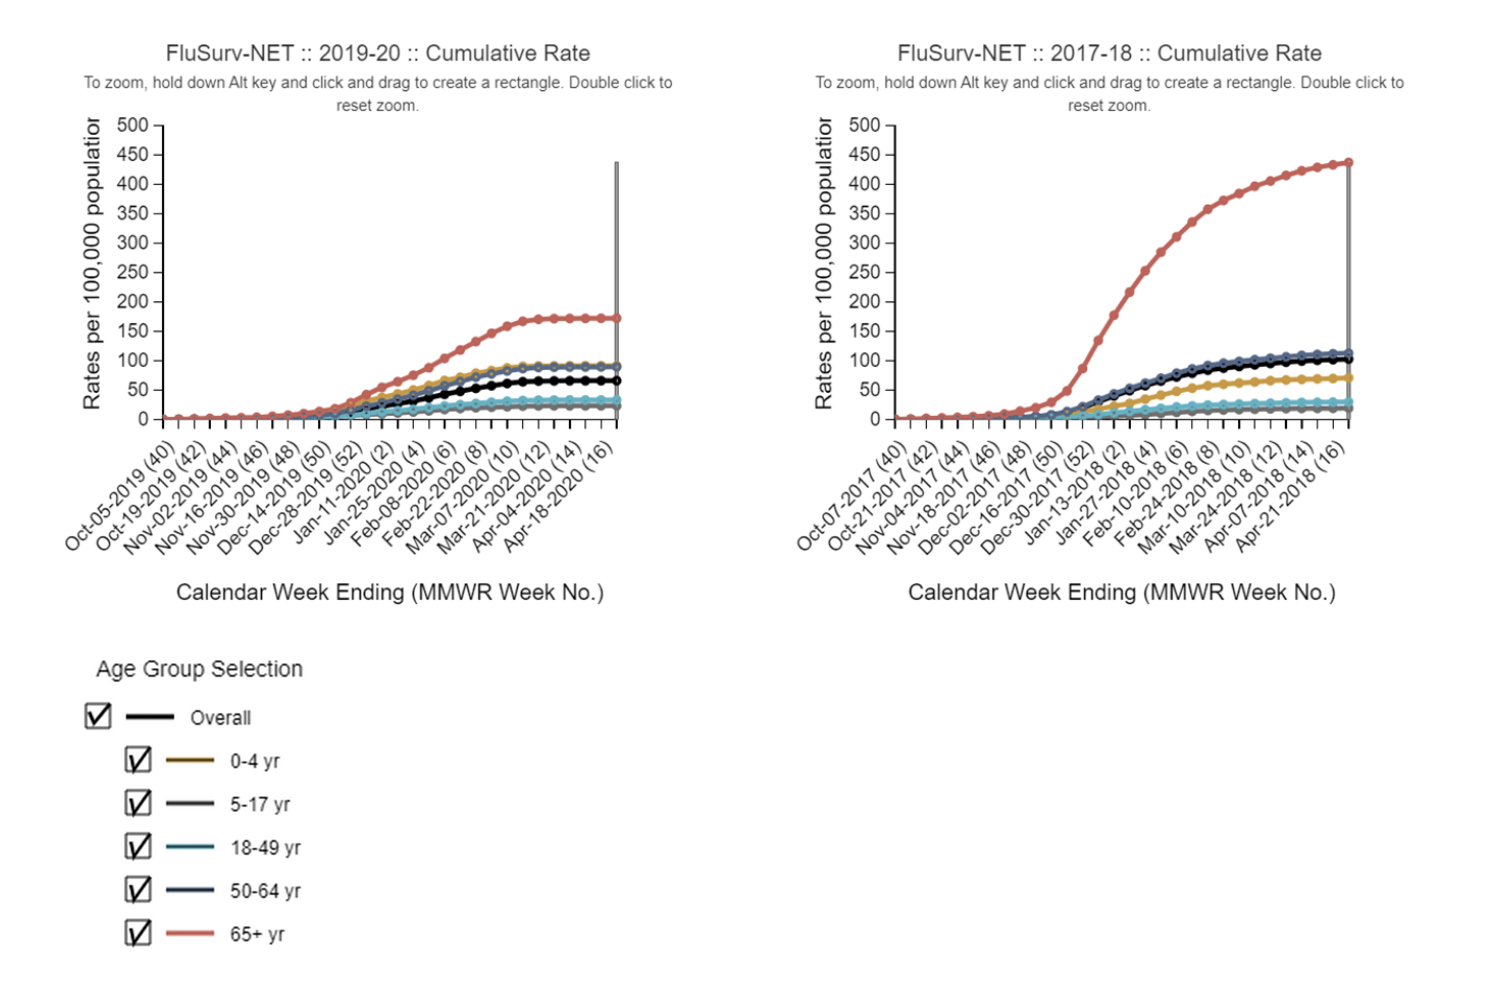
Recall that with the above published end-of-season summary estimates, the hospitalization burden is corrected for underreporting and should not be used for direct estimation of hospitalizations reported to HHS Protect. Using the age distribution of estimated hospitalizations provided in the above links is fine, as is using the age distribution reported in FluSurv-NET. FluSurv-NET is an influenza hospitalization surveillance network that collects data on laboratory-confirmed influenza-associated hospitalizations through a network of acute care hospitals in a subset of states (14 as of August 2023). Age-specific weekly rates per 100,000 population are reported in this system. State population sizes can be used to approximate hospital admission counts based on the observed rates. Additional details on interpreting FluSurv-NET data are available at https://www.cdc.gov/flu/weekly/influenza-hospitalization-surveillance.htm
The source of age distribution used for calibration (FluSurv-NET vs summary end-of-season CDC estimates) should be provided in the abstract meta-data.
See hospitalization curves below for reference (2019-20, 2017-18, FluSurvnet data).
Assumptions regarding vaccine effectiveness: We will use an all-age VE of 40% against medically attended influenza illnesses and hospitalizations, in line with what was reported for the 2017-18 and 2019-20 exemplar seasons. Teams who have developed age-stratified models can use the age-specific VE reported for these two seasons. Notably, the VE for the 2019-20 seasons (A/H1N1-dominated season, scenarios B, D, F) is stable across all age groups, while the VE for the 2017-18 season (A/H3N2-season, scenarios A, C, E) has a steep drop with increasing age.
- https://www.cdc.gov/flu/vaccines-work/2017-2018.html
- https://www.cdc.gov/flu/vaccines-work/2019-2020.html
We assume that VE against hospitalizations and medical illnesses is the same.
These 2019-20 and 2017-18 VE estimates should be considered as directly
applicable to the 2023-24 season, even though the exact mix of circulating
subtypes (particularly how much flu B may circulate) may differ.
As previously, assumptions about VE against infection and transmission are at
teams’ discretion.
Vaccine coverage assumptions: We have provided weekly state-level coverage to use in scenarios A-F here for age groups: 0-4yr, 5-12yr, 13-17yr, 0-17yr, 18-49yr, 50-64yr, 65+yr. These are based on vaccination rates reported in 2021-22 for business as usual scenarios (C, D), with 20% correction up (scenarios A, B) and down (scenarios E, F) to match scenario assumptions. The 20% changes have been applied to each age group and jurisdiction. I.e., if Alabama reported 50% coverage in age group 65+ in 2021-22, the assumed coverage for 2023-24 in low vaccination scenarios E and F is 50 * 0.8 = 40% in 2023-24. The timing of vaccination and relative differences between age groups and states will proceed similarly to past years, which has been taken into account in the vaccination file that we provide for the 2023-24 season. In summary, coverage data in this file can be used as is, without further adjustment.
TIMELINE: ROUND 1 2023-2024 FLU
- Scenarios set (no changes after): Friday, Aug 18, 2023
- Projections due: Tuesday, Sep 5, 2023
- Report finalized: No later than Friday, Sep 15, 2023
Prior Immunity*
-
Prior immunity is at teams discretion.
-
Prior influenza immunity is assumed to be a combination of residual immunity from previous infections and previous seasonal vaccinations. The exact specifications of prior immunity is left at the discretion of each team, and will depend on model specification, but we provide suggestions below.
-
At the onset of a typical influenza season (all subtypes combined), modeling has been estimated that around 30-35% of the population has prior immunity (65-70% susceptible), the effective reproduction number ranges from 1.2-1.4, and the attack rate (final size) is between 8-25% https://www.pnas.org/doi/pdf/10.1073/pnas.1415012112. The 2009 pandemic, which was marked by the emergence of a new strain to which individuals under the age of 50 yrs were susceptible, was associated with greater transmission (cumulative attack rates 32% over 2009) and decreased prior immunity compared to a regular season (prior immunity in 2009 is ~25% instead of ~33%).
-
Teams are allowed to vary prior immunity by virus subtype, age or other demographic characteristic, and state.
COVID-19 Interactions
- No major interactions with future COVID-19 surges (immunological, social, behavior) should be considered in this round.
Influenza strains
-
Hospitalization and death targets include the impact of all influenza subtypes combined. Influenza A/H3N2 is presumed to dominate in scenarios A, C, E and A/H1N1 in scenarios B, D, F. Weekly surveillance updates can be found here.
-
Subtype-specific models are allowed, for instance some amount of flu B is allowed.
- Disease burden and age distribution conditions should be applied to all subtypes/strains that aggregates to the overall conditions specified in the scenarios
-
Intrinsic transmissibility (R0): We assume the intrinsic transmissibility of H3N2 is same no matter the season, and the only changes in effective transmission of H3N2 between years come from differences in prior immunity and social mixing. The same logic applies to A/H1N1.
Vaccine immune waning
- Vaccine-induced immunity has been found to decrease rapidly over the course of an influenza season https://academic.oup.com/cid/article/64/5/544/2758477?login=true
Age groups
-
Age-stratification is optional. If stratified, immunity, disease burden, and vaccination should aggregate to specifications in scenarios
-
Suggested age-strata:
- 0-4, 5-17, 18-49, 50-64, and 65+ (or some aggregation of this, l ike 18-64, etc.). Most of the burden on hospitalization and deaths come f rom the 0-4 and 65+ age groups.
Projection period
- Sun Sep 3, 2023 to Sat June 1, 2024 (39 weeks)
Targets:
In this round, we will require submission of 100 individual trajectories for each target while submission of quantiles is optional. As a result, the only required targets for trajectories will be weekly incident hospitalizations and weekly deaths. Estimates of cumulative counts can be obtained from weekly trajectories and hence we do not require trajectories for cumulative counts. Similarly peak targets (peak hospitalization magnitude and peak timing) can be reconstructed from weekly trajectories. Teams who wish to submit quantiles along with trajectories should provide quantiles for weekly and cumulative counts, as well as for hospitalization peak size and peak timing.
-
Weekly target
-
Weekly reported state-level incident hospitalizations, based on HHS COVID and flu reporting system. This dataset is updated daily and covers 2020-2023. Weekly hospitalizations should be based on the “previous_day_admission_influenza_confirmed” variable, without any adjustment for reporting (=raw data from HHS dataset to be projected). A current version of the weekly aggregated data has been posted here
-
Weekly national incident deaths, from the CDC multiplier model (i.e., true mortality burden from the pyramid). These are real-time model estimates updated weekly during the influenza season. The model relies on influenza deaths reported in the hospitals via the FluSurv-NET system, adjusted for under testing of flu in the hospital and the proportion of deaths occurring outside of the hospital. There is no state detail. Preliminary estimates from the CDC burden model suggest that between October 1, 2022 - April 30, 2023, between 19,000 – 58,000 deaths were due to flu illness or flu-related complications. We have provided 3 historical seasons of weekly death estimates for calibration](https://github.com/midas-network/flu-scenario-modeling-hub_resources/blob/main/Rd1_datasets/In-season-National-Burden.csv). Further, see here for real-time cumulative estimates, and summary estimates for past seasons. A file of weekly cumulative estimates for the 2022-23 season is posted here.
-
No case target
-
No infection target
-
All targets should be numbers of individuals, rather than rates.
-
-
Optional targets (only if submitting quantiles in addition to trajectories):
- Cumulative hospitalizations. Cumulative outcomes start at 0 at the start of projections, on Sep 3, 2023. This is similar to rounds 1-3 2023-2023.
- State-level peak hospitalizations.
- State-level timing of peak hospitalizations
State-level variability
-
Vaccination coverage, age population. Variability in the age distribution of hospitalizations between states is allowed as long as it aggregates to the scenario definition for the US overall (population weighted average).
-
Variability in severity between states is possible
-
Prior immunity (due to a combination of vaccination and natural infection) can be the same or vary between states.
Cross-protection of subtype immunity: At the discretion of the teams.
Seasonality: Teams should include their best estimates of influenza seasonality in their model but we do not prescribe a specific level of seasonal forcing.
NPI: No reactive NPIs to COVID-19 or influenza; low level masking allowed at groups’ discretion.
Seeding of influenza: We leave seeding intensity, timing and geographic distribution at the discretion of the teams. In addition to the HHS hospital dataset, the flu portal dashboard is a good resource for state-specific information on strain circulation and epidemic intensity (eg, weekly % positive, or weekly ILI * % positive), and can be used to adjust seeding.
Initial Conditions: The mix of circulating strains at the start of the projection period is at the discretion of the teams based on their interpretation of the scenarios. Variation in initial prevalence between states is left at teams’ discretion.
All of the teams’ specific assumptions should be documented in metadata and abstract.
| Scenario | Scenario name | Scenario ID for submission file (scenario_id) |
|---|---|---|
| Scenario A. High vaccine coverage, A/H3N2 dominance | highVax_H3 | A-2023-08-14 |
| Scenario B. High vaccine coverage, A/H1N1 dominance | highVax_H1 | B-2023-08-14 |
| Scenario C. Business as usual vaccine coverage, A/H3N2 dominance | medVax_H3 | C-2023-08-14 |
| Scenario D. Business as usual vaccine coverage, A/H1N1 dominance | medVax_H1 | D-2023-08-14 |
| Scenario E. Low vaccine coverage, A/H3N2 dominance | lowVax_H3 | E-2023-08-14 |
| Scenario F. Low vaccine coverage, A/H1N1 dominance | lowVax_H1 | F-2023-08-14 |
- Projection Due date: Tuesday September 5, 2023
- End date for fitting data: Between Saturday Aug 19 and Saturday Sep 2, 2023
- Start date for scenarios: Sunday September 3, 2023 (first date of simulated transmission/outcomes)
- Simulation end date: June 1, 2024 (39-week horizon)
- Desire to release results by mid-September 2023
Other submission requirements
-
Simulation trajectories: We ask that teams submit a sample of up to 100 simulation replicates. Simulations should be sampled in such a way that they will be most likely to produce the same summary statistics as that quantile submitted. For some models, this may mean a random sample of simulations, for others with arger numbers of simulations, it may require weighted sampling.
-
Geographic scope: state-level and national projections
- All states not required, US overall recommended.
-
Results:
-
Summary: Results must consist of a subset of weekly targets listed below; all are not required. Weeks follow epi-weeks (Sun-Sat) dated by the last day of the week.
-
Weekly Targets (subset of: hospitalizations, deaths)
- Weekly incident
-
-
Metadata: We will require a brief meta-data form, from all teams.
-
Uncertainty:
- For trajectories (required submission): we require 100 trajectories.
- For quantiles (optional submission): we ask for 0.01, 0.025, 0.05, every 5% to 0.95, 0.975, and 0.99. Teams are also encouraged to submit 0 (min value) and 1 (max) quantiles if possible.
-
We use the HHS COVID-19 Reported Patient Impact and Hospital Capacity by State Timeseries. The target to be projected is confirmed influenza hospital admissions, reported as previous_day_admission_influenza_confirmed. Therefore, before aggregating to the weekly values, the gold standard or “truth” data will shift the values in the date column one day earlier so that the date aligns with the date of admission. As an example, if 17 confirmed influenza hospital admissions were reported in the
previous_day_admission_influenza_confirmedfield in a row where thedate fieldwas 2021-10-30, then the “truth” dataset would assign those 17 hospital admissions to a date of 2021-10-29. These cases would then be counted towards the weekly total computed for EW43, which runs from 2021-10-24 through 2021-10-30. -
Influenza admission reporting became mandatory in this dataset on Feb-02-2021, and should continue to be mandatory for the duration of the summer and into the next flu season. Accordingly, more than 41,000 US hospitals are reporting flu on a weekly basis and no adjustment for reporting changes should be made. However the data before Feb-02-2021 should be treated with caution.
-
Unlike flu admissions, flu deaths are no longer mandatory to report in this system and hence a different source of data will be used for deaths.
-
There is no age breakdown for flu in this HHS dataset. If teams need age-specific hospitalization data for calibration, or a longer dataset, they can apply the age distribution of flu hospitalizations available in Flusurv-NET to the all-age HHS rate. Flusurv-NET is CDC’s parallel and long-running hospitalization surveillance system, which is based on a smaller set of US hospitals (9%). We have provided state-specific time series here (2003-present). Because Flusurv-NET data is not available for all states, we recommend that teams use the national age distribution of hospitalizations estimated in Flusurv-NET and apply it to national and state-specific HHS data. Adjustment for demographic differences between states can be considered, but are not required.
-
Earlier analyses have shown that estimates of influenza incidences are consistent between the HHS and CDC hospital surveillance systems in areas where both systems overlap. The flusurvnet data estimates ~15% fewer hospitalizations nationally than the HHS system based on 2021-22 data; however these differences may vary during the 2022-23 season.
See https://delphi.cmu.edu/flu/
API documentation: https://cmu-delphi.github.io/delphi-epidata/
- This includes HHS flu hospitalizations: https://cmu-delphi.github.io/delphi-epidata/api/covidcast-signals/hhs.html
- Outpatient ILI (influenza and other similar illnesses) computed from medical insurance claims: https://cmu-delphi.github.io/delphi-epidata/api/covidcast-signals/chng.html
Groups interested in participating can submit model projections for each scenario in a parquet file formatted according to our specifications, and a metadata file with a description of model information. See here for technical submission requirements. Groups can submit their contributions as often as they want; the date of when a model projection was made (projection date) is recorded in the model submission file.
For Flu hospitalizations, we use the HHS COVID-19 Reported Patient Impact and Hospital Capacity by State Timeseries. The target to be projected is confirmed influenza hospital admissions, reported as "previous_day_admission_influenza_confirmed". Therefore, before aggregating to the weekly values, the gold standard or “truth” data will shift the values in the date column one day earlier so that the date aligns with the date of admission. As an example, if 17 confirmed influenza hospital admissions were reported in the "previous_day_admission_influenza_confirmed" field in a row where the date field was 2021-10-30, then the “truth” dataset would assign those 17 hospital admissions to a date of 2021-10-29. These cases would then be counted towards the weekly total computed for EW43, which runs from 2021-10-24 through 2021-10-30.
For Flu death, we use weekly estimates of cumulative influenza-related deaths based on CDC multiplier model, the data are available in the flu-scenario-modeling-resources GitHub repository in the CumulativeDeath folder. The model is based on in-hospital deaths reported to flusurvnet and accounts for lack of influenza testing in the hospital, and deaths occurring outside of the hospital system. Estimates provided in this file are the 2.5% and 97.5% quantiles (95% uncertainty interval).
We aim to combine model projections into an ensemble.
We are grateful to the teams who have generated these scenarios. The groups have made their public data available under different terms and licenses. You will find the licenses (when provided) within the model-specific folders in the data-processed directory. Please consult these licenses before using these data to ensure that you follow the terms under which these data were released.
All source code that is specific to the overall project is available under an open-source MIT license. We note that this license does NOT cover model code from the various teams or model scenario data (available under specified licenses as described above).
Those teams interested in accessing additional computational power should contact Katriona Shea at k-shea@psu.edu.
- California Department of Public Health — FluCAT
- White, L.A. (CADPH), Murray, E. (CADPH), Leon, T.M. (CADPH)
- Center For Disease Dynamics, Economics & Policy — FluCompModel
- Fardad Haghpanah, Eili Klein
- Johns Hopkins ID Dynamics — COVID Scenario Pipeline
- Joseph C. Lemaitre (UNC), Joshua Kaminsky (Johns Hopkins Infectious Disease Dynamics), Claire P. Smith (Johns Hopkins Infectious Disease Dynamics), Sara Loo (Johns Hopkins Infectious Disease Dynamics), Clif McKee (Johns Hopkins Infectious Disease Dynamics), Alison Hill (Johns Hopkins Infectious Disease Dynamics), Sung-mok Jung (UNC), Erica Carcelen (Johns Hopkins Infectious Disease Dynamics), Koji Sato (Johns Hopkins Infectious Disease Dynamics), Elizabeth C. Lee (Johns Hopkins Infectious Disease Dynamics), Justin Lessler (UNC), Shaun Truelove (Johns Hopkins Infectious Disease Dynamics)
- Northeastern University MOBS Lab — GLEAM FLU
- Matteo Chinazzi (Northeastern University, Boston, MA), Jessica T. Davis (Northeastern University, Boston, MA), Kunpeng Mu (Northeastern University, Boston, MA), Alessandro Vespignani (Northeastern University, Boston, MA)
- Fogarty International Center, National Institutes of Health (NIH) — Flu_TS
- Amanda Perofsky (NIH), Cécile Viboud (NIH)
- University of Notre Dame — FRED
- Guido Espana, Sean Moore, Alex Perkins
- University of Southern California — SIkJalpha
- Ajitesh Srivastava, Majd Al Aawar
- University of Texas — ImmunoSEIRS
- Kaiming Bi (The University of Texas at Austin), Anass Bouchnita (The University of Texas at El Paso), Shraddha R Bandekar (University of Texas at Austin), Spencer J. Fox (The University of Georgia), Lauren Ancel Meyers (The University of Texas at Austin), UT COVID-19 Modeling Consortium.
- University of Virginia Biocomplexity Institute — EpiHiper
- Jiangzhuo Chen (UVA), Stefan Hoops (UVA), Parantapa Bhattacharya (UVA), Dustin Machi (UVA), Bryan Lewis (UVA), Madhav Marathe (UVA)
- University of Virginia Biocomplexity Institute — FluXSim
- Srini Venkatramanan, Aniruddha Adiga, Przemek Porebski, Brian Klahn, Benjamin Hurt, Bryan Lewis (UVA), Madhav Marathe (UVA)
- Fogarty International Center, National Institutes of Health (NIH) — FluD
- Samantha Bents (NIH), Cécile Viboud (NIH)
- Public Health Dynamics Laboratory — FREDMODEL
- Mary G Krauland
- Predictive Science — M1
- Ben-Nun M (Predictive Science), Turtle J (Predictive Science), Riley P (Predictive Science)
- Shaun Truelove, Johns Hopkins University
- Cécile Viboud, NIH Fogarty
- Justin Lessler, University of North Carolina
- Sara Loo, Johns Hopkins University
- Lucie Contamin, University of Pittsburgh
- Emily Howerton, Penn State University
- Claire Smith, Johns Hopkins University
- Harry Hochheiser, University of Pittsburgh
- Katriona Shea, Penn State University
- Michael Runge, USGS
- Erica Carcelen, John Hopkins University
- Sung-mok Jung, University of North Carolina
- Jessi Espino, University of Pittsburgh
- John Levander, University of Pittsburgh
- Samantha Bents, NIH Fogarty
- Katie Yan, Penn State University
- Wilbert Van Panhuis, University of Pittsburgh
- Jessica Kerr, University of Pittsburgh
- Luke Mullany, Johns Hopkins University
- Kaitlin Lovett, John Hopkins University
- Michelle Qin, Harvard University
- Tiffany Bogich, Penn State University
- Rebecca Borchering, Penn State University