Custom labels in colorbar #895
Conversation
|
Can a developer please verify this PR for testing? |
|
@matlab2tikzBot please test this |
| @@ -4500,6 +4500,34 @@ function warnFacetedInterp(m2t) | |||
| end | |||
| end | |||
| % ============================================================================== | |||
| function cbarStyleOptions = getColotBarTicks(handle, cbarStyleOptions) | |||
There was a problem hiding this comment.
There is a typo in the function name.
|
Thank you very much for that PR. That is a good usecase and will definitely improve m2t. However, I think the code is not there yet. Especially considering that we already have an infrastructure for TickLabels. From a glance at function [options] = getAxisTicks(m2t, handle, axis, options)I would guess, that you could achieve all that you want by passing an empty "axis" argument. Maybe we will need some checks against that but I think that might be a suitable approach. |
|
Thanks for your succession I found that all the functionality was already in the project I just needed to apply it to this axis label type. |
| axisOptions = opts_add(axisOptions, strtrim(['colorbar ', cbarTemplate])); | ||
|
|
||
|
|
||
| %color map ticks | ||
| [m2t, options] = getAxisOptions(m2t, handle, 'y'); |
There was a problem hiding this comment.
Here you can just pass cbarStyleOptions directly.
[m2t, cbarStyleOptions] = getAxisOptions(m2t, handle, 'y', cbarStyleOptions);Then there is no need to merge below.
There was a problem hiding this comment.
Additionally getAxisOptions assumes that options is a valid container, so that would break most likely
|
I am unsure about the attached pdf/jpg. They generally do not make thatmuch sense if you are not a developer. @egeerardyn thoughts? |
|
@miscco I agree. Attaching the produced output makes little sense for a normal user, I would say. So it's probably better to remove them from the repository. |
|
We should add the feature to For this, we need:
|
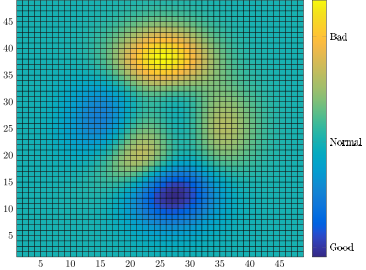
added support for custom Tick labels on color bar
code:
without the Changes:

With the changes: