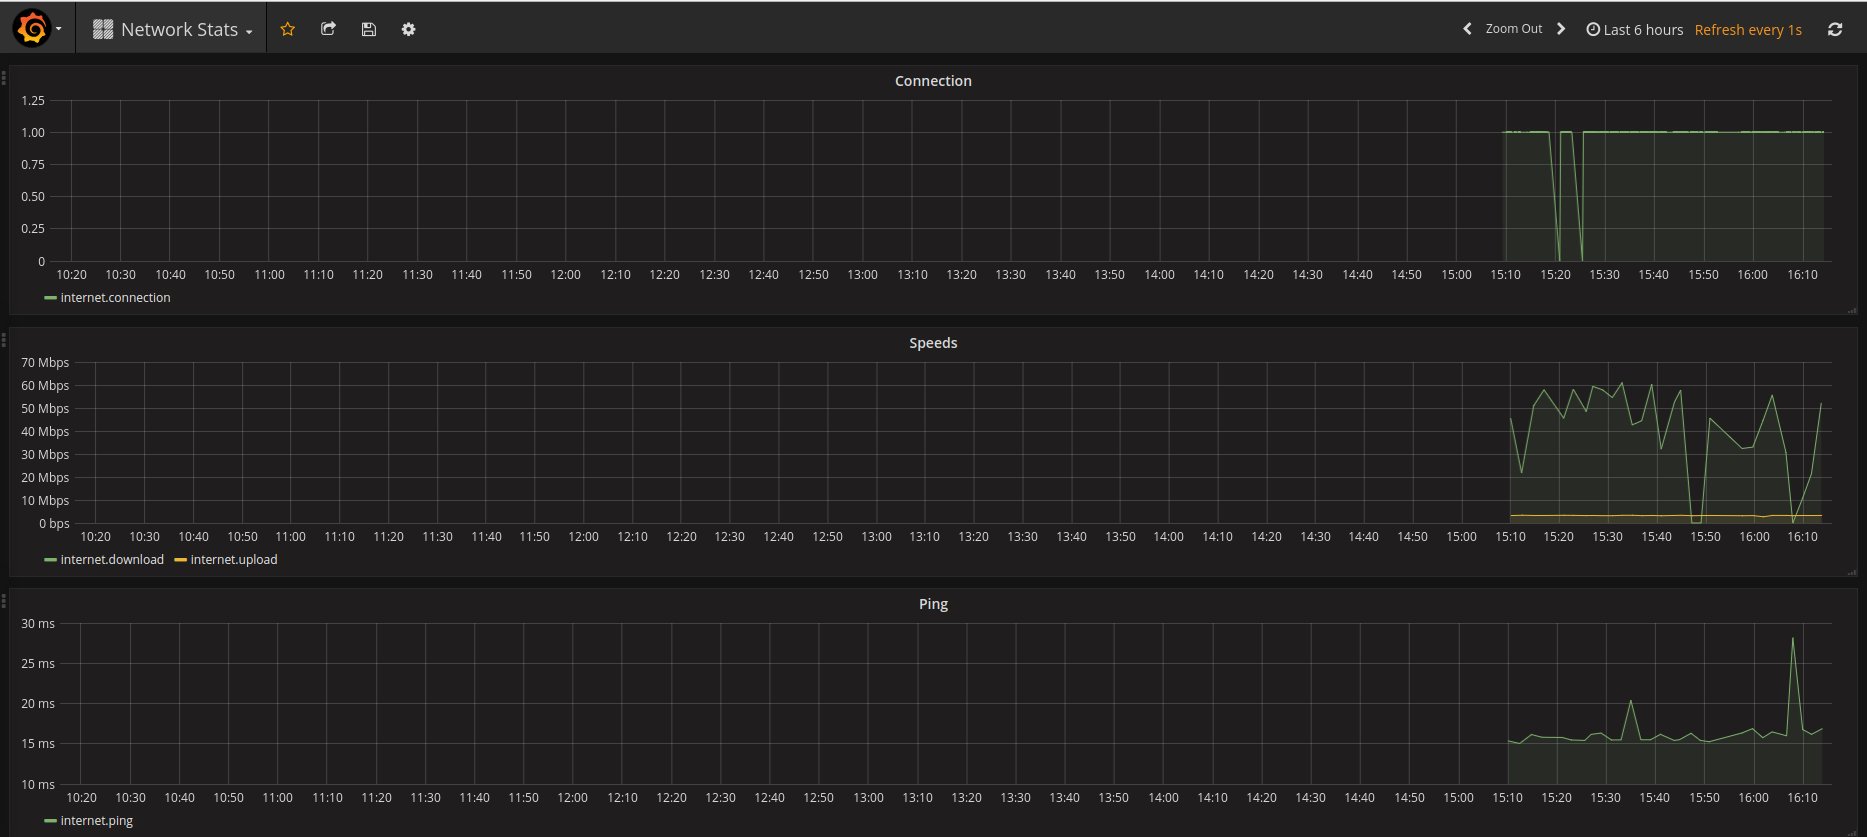
I was very frustrated with the quality of service of my ISP. When I complained, tech support just blew me off saying that my intenet connection works flawlessly. So, being an developer, I've made this tiny project that records internet stats and visualizes them.
This repo conatins a simple Docker-compose setup that consists of:
- Sampler - a simple Python script that measures your internet connection, speed (up/down) and ping
- OpenTSDB - DB that keeps that data
- Grafana - visualizes the data
(A bit of an overkill? maybe.)
Start with: docker-compose up -d.
The Grafana dashboard will be available at http://localhost:3000/dashboard/db/network-stats. Use admin as username and password.
Metrics should appear after a minute or so.
PRs welcome. Good luck with that ISP!