For this analysis / visualisation I use Google Analytics scroll tracking to collect data. Collecting the data and pulling it into R has been described in detail by Ryan Praskievitz on his blog: http://www.ryanpraski.com/scroll-depth-tracking-analysis-with-google-analytics-r
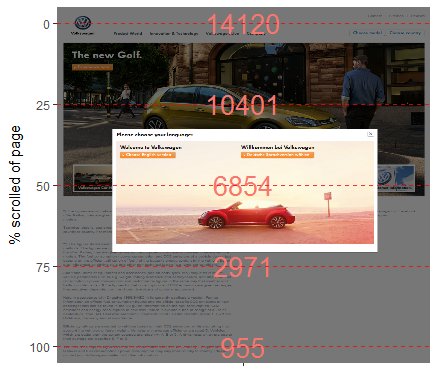
The visualisation that I built with this R script is particularly useful for individual page analysis; analysing the use of a landingpage or other important page.
The packages I have used are:
- googleAnalyticsR (pulling data from Google Analytics)
- webshot (creating a .png based on a screenshot of the page)
- ggplot2 (building the visualisation)
- png (to read the .png)
- lubridate (format the date of the Google Analytics query)
- grid (to add the background image to ggplot2)
I welcome feedback on this setup. My R knowledge is still fairly limited, so this code can probably be made faster/ efficient with the right skills. Also would love to learn about additional features/ applications you would use to update this visualisation.