The Criminality Information Group of the Colombian Police recently published more than 27,000 records of sexual crimes commited during the year 2016. Based on this information –and as part of a course on Visual Analytics–, I decided to start a small project in order to visualize the data and extract insights that may (or may not) be useful in addressing the issue. As these conclusions depend entirely on the trustworthiness of the raw data and a small amount of pre processing, they should not be taken very seriously. Rather, this project should show how useful an adequate process of data collection would be in tackling these crimes. The following are some interesting findings:
See the demo here.
My first approach was to organize the records based on their date. The following visualization shows the number of sexual crimes registered in Colombia during 2016, organized by day and month. As you can see, the first day of each month is when most of the crimes were commited (or at least registered).
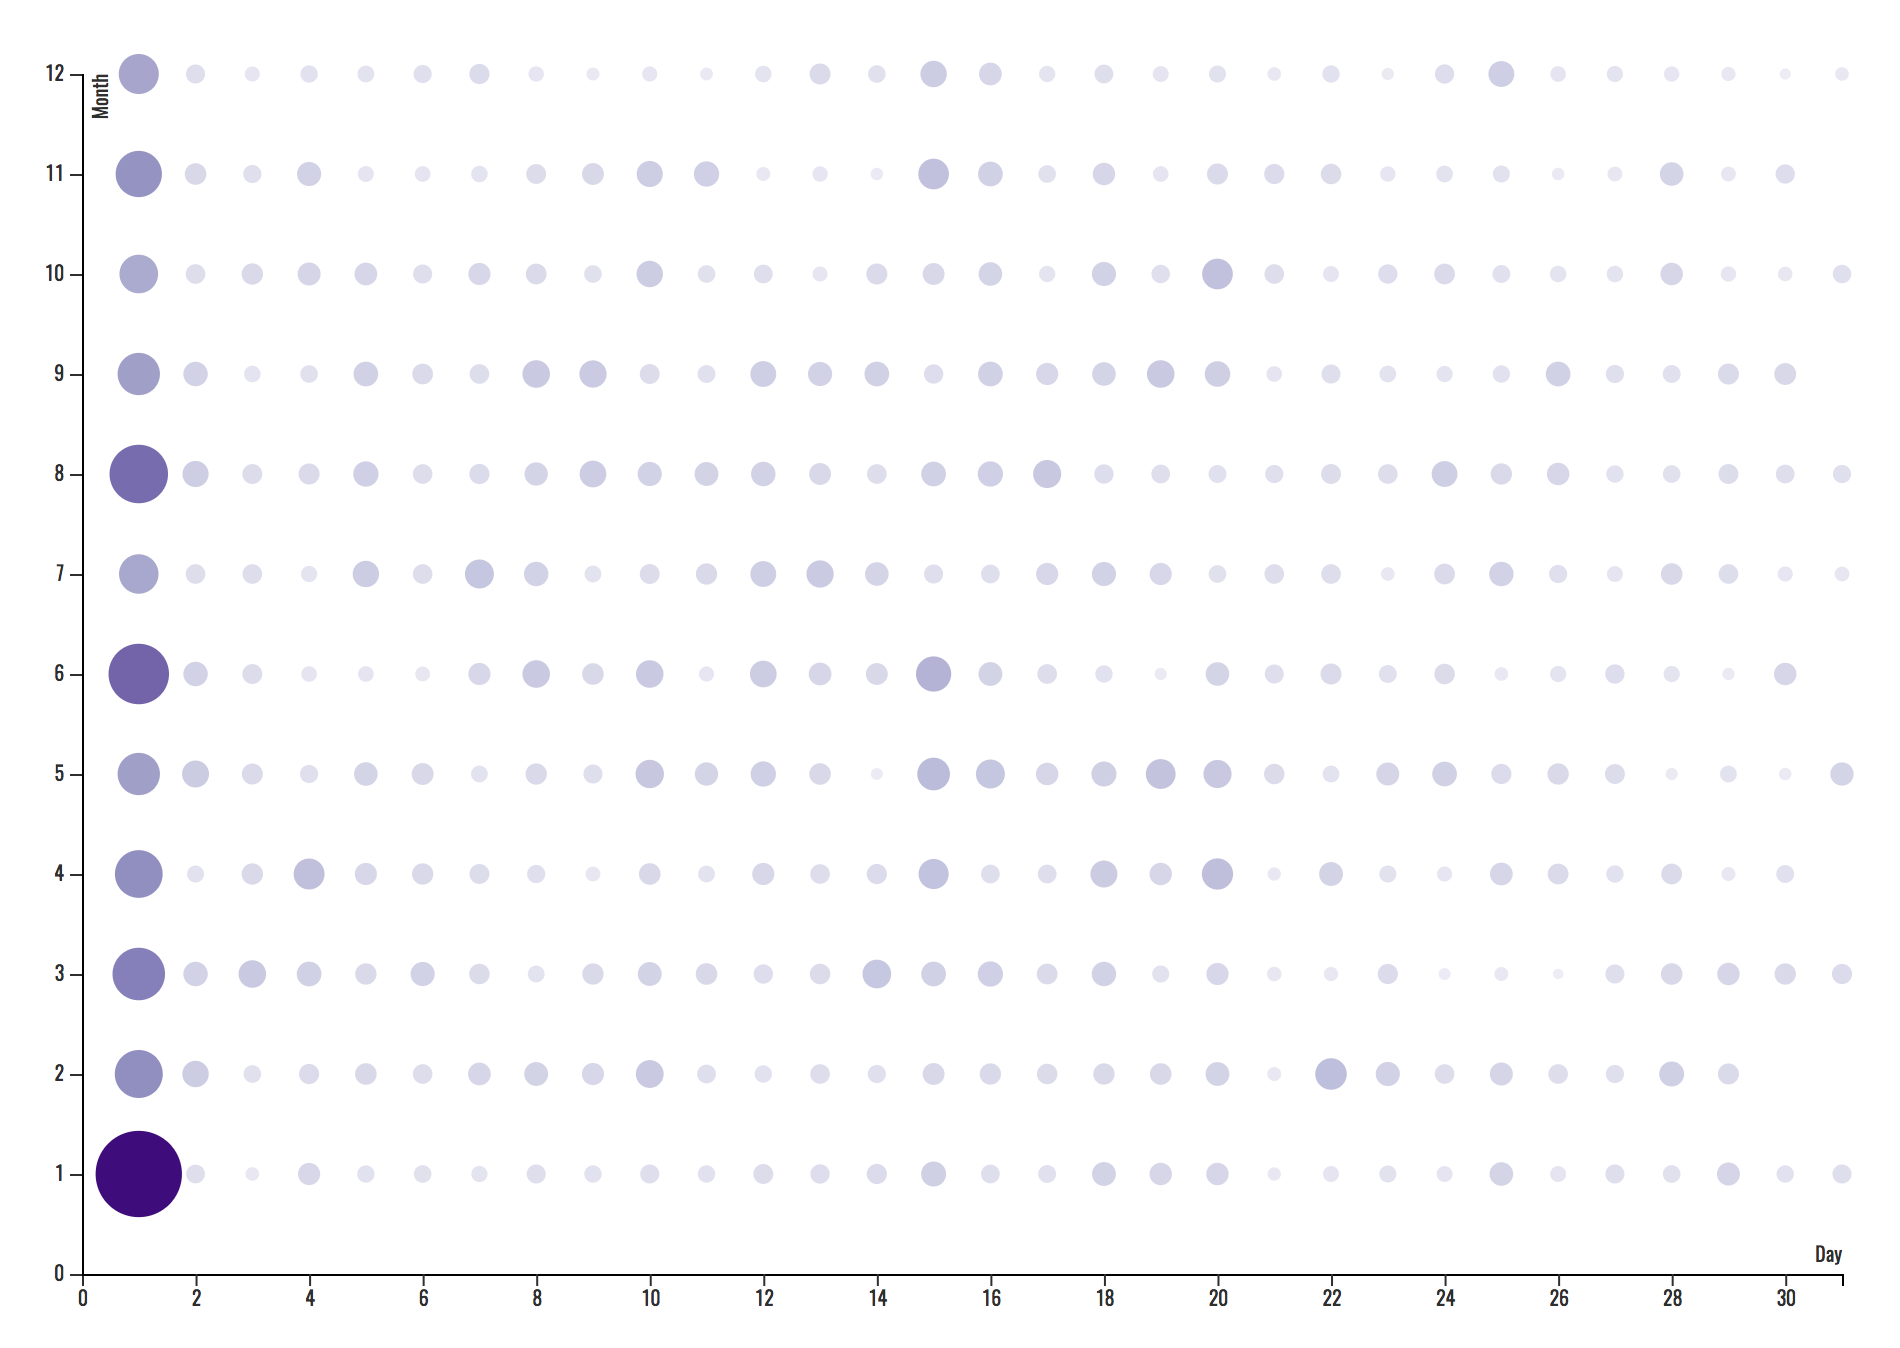
See the demo here.
A second approach consisted on visualizing the data based on the genre of the victim and the day in which the crime was committed (or registered). Although it was expected to find more records with women as victims, the graphic shows an interesting contrast between the number of crimes committed on Friday versus the number of crimes committed on Saturday.
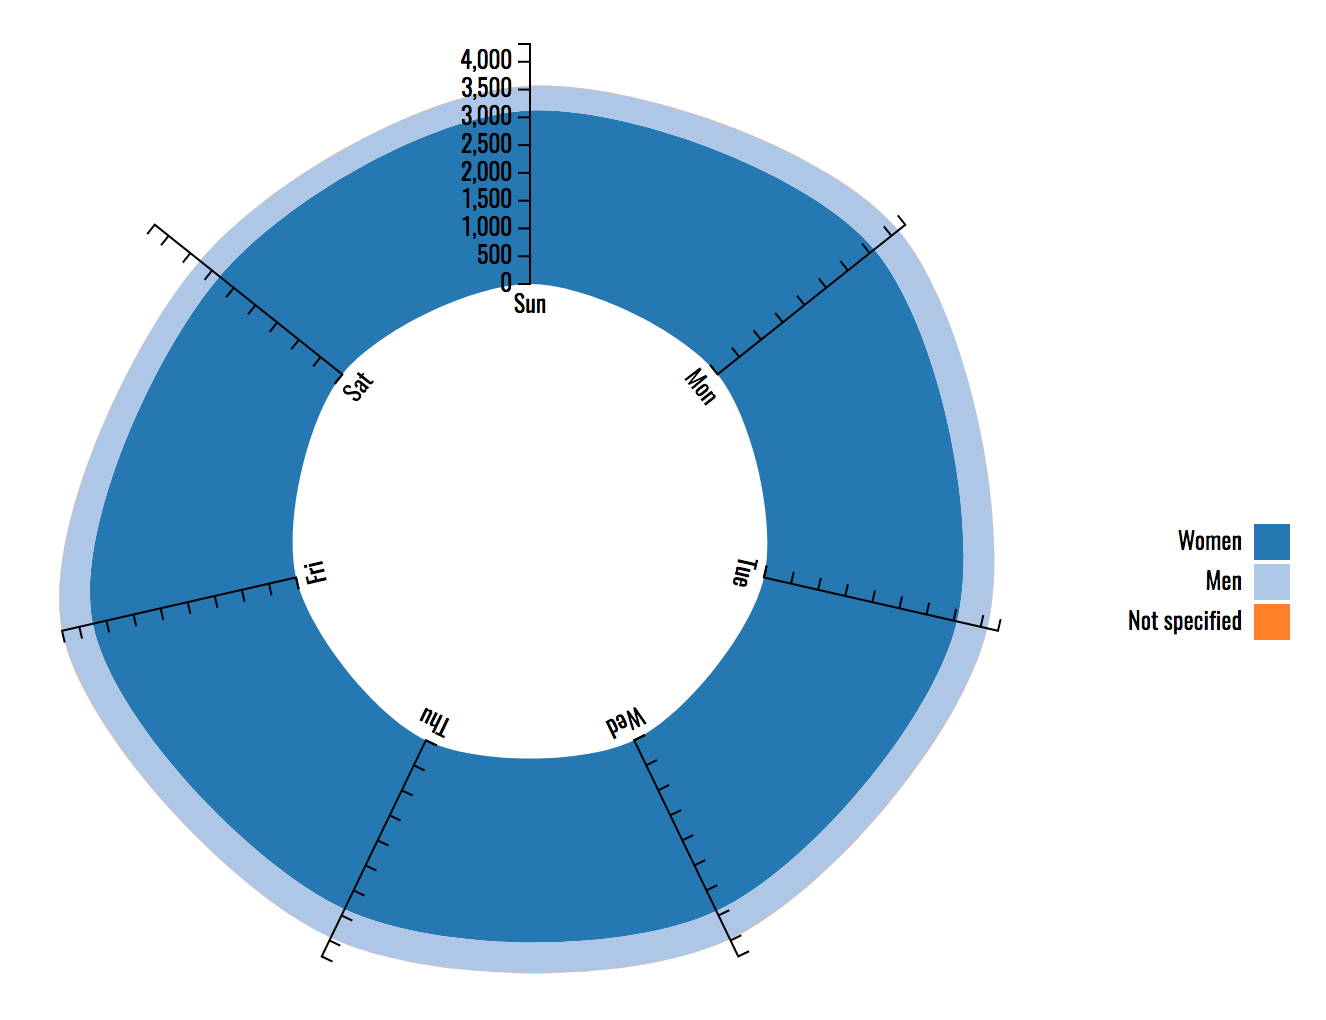
See the demo here.
In my third approach I had to visualize network data. As I wanted to keep working on this project, I managed to derive two datasets (one for nodes and one for links) based on information about the transportation methods that both victims and assailants were using when the crime was commited. I then implemented an adjacency matrix in which the columns show the attacker's transportation method and the rows match the victim's one. The most important finding obtained from this process was the alarming quantity of crimes commited when both the assailant and victim were moving on foot. Also, it was interesting to see the correspondence between passenger and driver as attacker and victim (or vise versa).
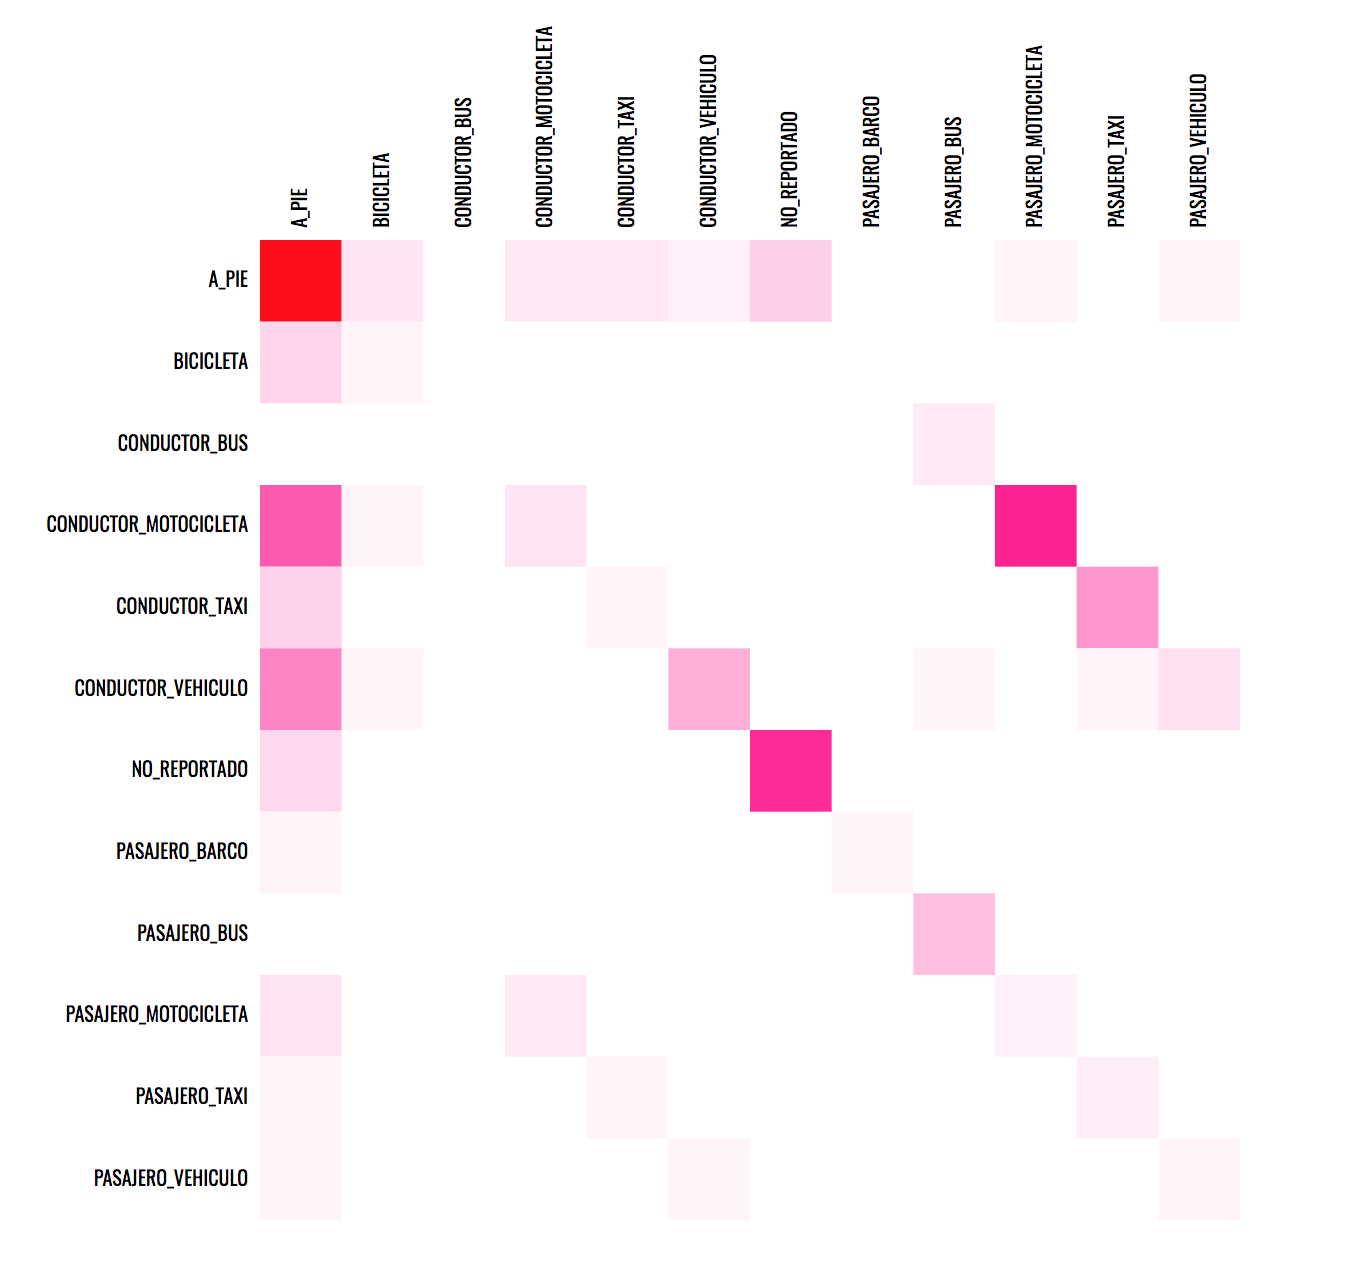
More updates coming soon! 🌟