[warning] This is a project I made before Python3 caught on, and I'd need to refactor a lot to make this secure to use. Therefore I recommend you do not do so. I'll likely take a stab at rewriting this in mid 1019 using Python 3 and FitBit's API. (RIP my poor old Google Watch)
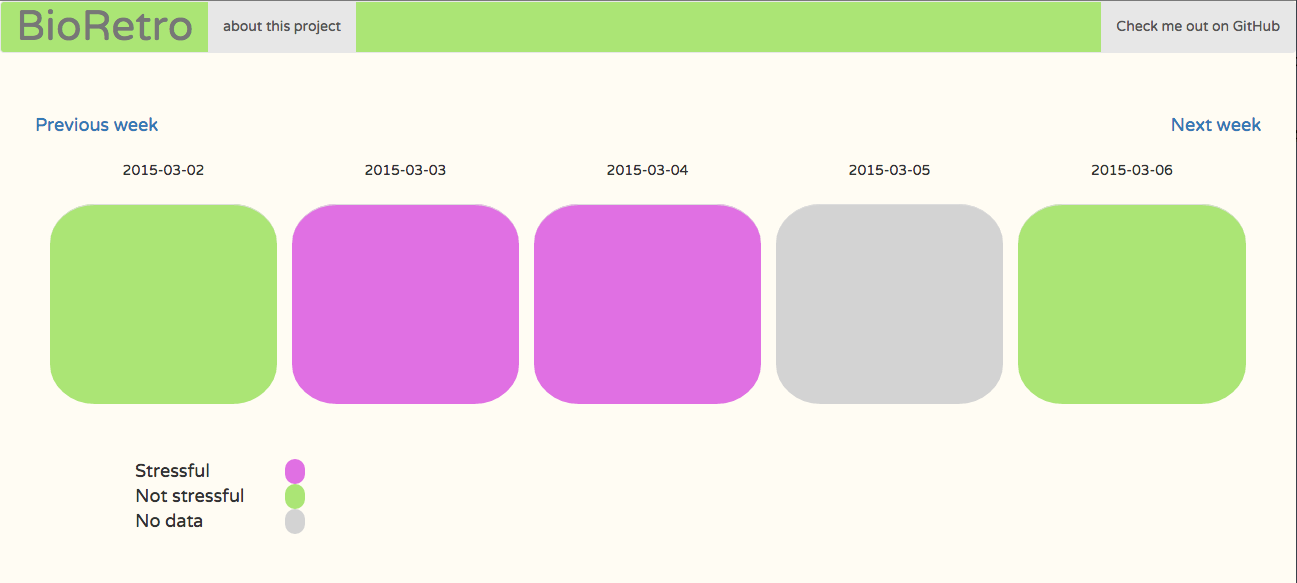
Inspired by the Agile practice of team retrospectives and by personal mindfulness techniques, BioRetro allows users to better understand when stressful moments are ocurring in their daily work day. By using beat per minute (BPM) data from the Google Fit API, BioRetro determines if a given moment in the user's day appears to be stressful, and creates a calendar-style visualization indicating where the stressful moment occurred.
In order to use this app, users must have access to hardware which can sense heart rate and send that data to Google Fit. This can be a stock wearable device, or any Android .apk which writes BPM data to the Google Fit API.
PLEASE NOTE: This tool is intended for users' own personal introspection and heath maintenence. It IS NOT intended to be used during a sprint retrospective meeting unless everyone on the team is comfortable sharing personal biofeedback metrics, which not everyone may want to do.
###Contents
-Technologies
-How it works
-References
![Screengrab of the week calendar view] (https://raw.githubusercontent.com/mandagill/BioRetro/master/BioRetro_screengrab.png)
###Technologies used:
Flask, OAuth2, SQLAlchemy, PostgreSQL, JavaScript/JQuery, Jinja2, Google Fit API, Android Wear
###How it works:
After authorizing Google, users have the option of updating their data in the app from the Google Fit API, or of viewing the most recent week's retrospective report.
Data is pre-processed when it's pulled in from Google, and written to the database with an is_stressful flag being set at the time it's fetched from the API. An individual data point is determined to be stressful by comparing it to the mean BPM level for a given user for the 7 days preceeding the given data point. So if I am checking if a point taken at 3pm on March 17th, 2015 is stressful, the app queries the database for data from March 10th, 2015 at 3 pm until 3pm March 17th, and compares it to that data set.
When a point is being pre-processed, first it is checked to see if it occurs between normal working hours, indicating the point most likely falls in the BPM range classified as ambient heart rate, or AHR (not to be confused with resting heart rate, or RHR, which is determined when the body is completely at rest, first thing in the morning).
Then if a point is 9 bpm or higher than the mean of the preceeding week's AHR data, first the app checks the Fit API for any motion that ocurred before the point was taken (which would indicate exercise, rather than stress). If there is no connected motion, the point is flagged as stressful, then committed to the app database. This speeds up page performance when the user views a retrospective report.
When the week's calendar is viewed, days which have non-stressful data are colored green, and days with stressful data are colored in purple. If no data is present, the day is colored grey. Users can then zoom in on an hourly view to see what time during the day the stressful data point(s) occurred.
###References
http://www.ncbi.nlm.nih.gov/pubmed/19162747
http://www.humankinetics.com/excerpts/excerpts/take-care-of-yourself-with-emotional-fitness-training