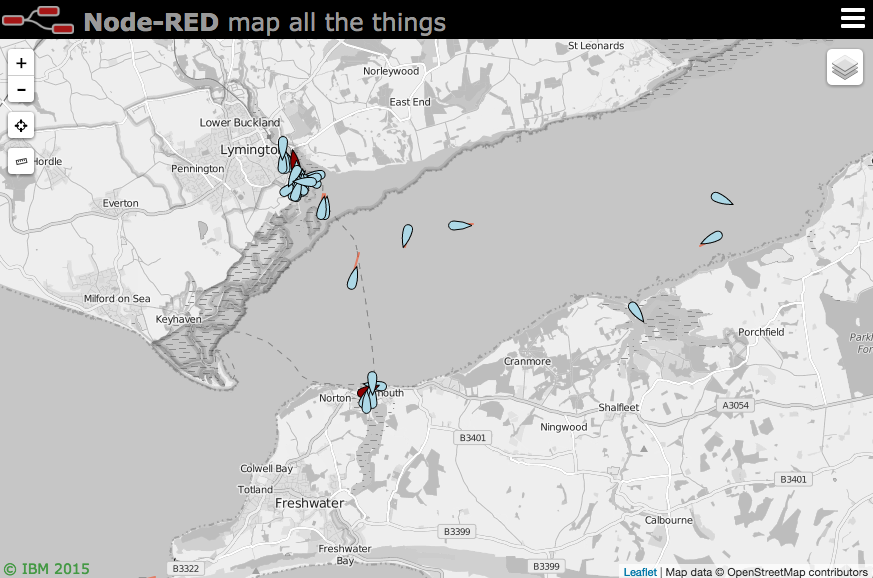
A Node-RED node to provide world map web page for plotting "things" on.
- v1.5.13 - Send click message to websocket on marker click - Issue #56, #57
- v1.5.11 - Let search also try geocoding lookup if not found in marks.
- v1.5.10 - Allow latest mark added to open popup, and allow
popped=falseto close. - v1.5.7 - Tidy up sidc entry, and drag-ability of nodes on drawing layer.
- v1.5.6 - Add search command and clear search functionality.
- v1.5.5 - Allow multiple overlays to be enabled at once - Issue #53
- v1.5.4 - Allow remote update of the split position via
msg.command.split - v1.5.3 - Add side by side mode (via
msg.commandonly). - v1.5.2 - Make manually added icons moveable by default.
- v1.5.0 - Add multi-map capability - can now have multiple map endpoints.
- Also add built-in world countries overlay layer for offline use.
- ...
see CHANGELOG for full list.
Either use the Manage Palette option in the Node-RED Editor menu, or run the following command in your Node-RED user directory - typically ~/.node-red
npm i --save node-red-contrib-web-worldmap
Plots "things" on a map. By default the map will be served from {httpRoot}/worldmap
Use keyboard shortcut ⌘⇧m, ctrl-shift-m to jump to the map.
The minimum msg.payload must contain name, lat and lon properties, e.g.
msg.payload = { name:"Jason", lat:51.05, lon:-1.35 }
name must be a unique identifier across the whole map. Repeated location updates to the same name move the marker.
Optional properties include
- deleted : set to true to remove the named marker. (default false)
- draggable : set to true to allow marker to be moved. (default false)
- layer : specify a layer on the map to add marker to. (default unknown)
- speed : combined with bearing, draws a vector.
- bearing : combined with speed, draws a vector.
- accuracy : combined with bearing, draws a polygon of possible direction.
- icon : font awesome icon name.
- iconColor : Standard CSS colour name or #rrggbb hex value.
- SIDC : NATO symbology code (instead of icon). See below.
- building : OSMbulding GeoJSON feature set to add 2.5D buildings to buildings layer. See below.
- ttl : time to live, how long an individual marker stays on map in seconds (overrides general maxage setting)
- photoUrl : adds an image pointed at by the url to the popup box.
- videoUrl : adds an mp4 video pointed at by the url to the popup box. Ideally 320x240 in size.
- weblink : adds a link to an external page for more information. Either set a url as a string, or an object like
{name:"BBC News", url:"http://news.bbc.co.uk", target:"_new"} - addtoheatmap : set to false to exclude point from contributing to heatmap layer. (default true)
- intensity : set to a value of 0.1 - 1.0 to set the intensity of the point on heatmap layer. (default 1.0)
- popped : set to true to automatically open the popup info box, set to false to close it.
- popup : html to fill the popup if you don't want the automatic default of the properties list.
Any other msg.payload properties will be added to the icon popup text box.
You may select any of the Font Awesome set of icons.
If you use the name without the fa- prefix (eg male) you will get the icon inside a generic marker shape. If you use the fa- prefix (eg fa-male) you will get the icon on its own.
There are also several special icons...
- plane : a plane icon that aligns with the bearing of travel.
- ship : a ship icon that aligns with the bearing of travel.
- car : a car icon that aligns with the bearing of travel.
- uav : a small plane icon that aligns with the bearing of travel.
- arrow : a map GPS arrow type pointer that aligns with the bearing of travel.
- wind : a wind arrow that points in the direction the wind is coming FROM.
- satellite : a small satellite icon.
- iss : a slightly larger icon for the ISS.
- locate : a 4 corner outline to locate a point without obscuring it.
- friend : pseudo NATO style blue rectangle.
- hostile : pseudo NATO style red circle.
- neutral : pseudo NATO style green square.
- unknown : pseudo NATO style yellow square.
- earthquake : black circle - diameter proportional to
msg.mag.
You can use NATO symbols from milsymbol.js.
To do this you need to supply a msg.SIDC instead of an icon, for example:
msg.payload = { name: "Emergency Medical Operation",
    lat: 51.05,
    lon: -1.35,
    SIDC: "ENOPA-------",
    options: { fillOpacity:0.8 }
}
SIDC codes can be generated using the online tool - https://spatialillusions.com/unitgenerator/
There are lots of extra options you can specify as msg.options - see the milsymbol docs here.
The OSM Buildings layer is available in the layers menu. You can replace this with a building of your own by
sending a msg.payload.command.map containing an overlay and a geojson property. The geojson property
should be a GeoJSON Feature Collection as per the OSMBuildings spec.
var geo = { "type": "FeatureCollection",
"features": [
  {
    "type": "Feature",
    "properties": {
      "color": "rgb(0,0,255)",
      "roofColor": "rgb(128,128,255)",
      "height": 20,
      "minHeight": 0
    },
    "geometry": {
      "type": "Polygon",
      "coordinates": [
        [
        [-1.356221,51.048611],
        [-1.356039,51.048672],
        [-1.355765,51.048311],
        [-1.355937,51.048237],
        [-1.356221,51.048611]
        ]
      ]
    }
  }
]
}
var m = {overlay:"Golf Clubhouse", geojson:geo, fit:true};
msg.payload = {command:{map:m, lat:51.0484, lon:-1.3558}};
return msg;
Note: the object you supply will replace the whole buildings layer. To delete the building send a msg with a name and the building property set to "" (blank string).
A 3D map view has now been added as worldmap/index3d.html using the mapbox api - the msg can support msg.command.pitch and msg.command.bearing to angle the view, for example:
msg.payload = { command: {
        zoom:18,
        pitch:60,
        bearing:80
    } }
The icon can be specified as a person, block, bar, or "anything else" - they will render slightly differently - all units are approximate. They will be positioned at the lat, lon as normal but also at the msg.payload.height - where height is in meters above the surface of the map (which may or may not relate to altitude...)
msg.payload.icon can be
- person : 1m x 1m x 2m tall
- block : 5m x 5m x 5m cube
- bar : a bar from the surface up to the specified minHeight
- (else) : 1.5m x 1.5m x 1.5m cube
in addition existing male, female, fa-male and fa-female icons are all represented as the person shape.
msg.iconColor can be used to colour the icons.
NOTES
- There is currently no way to add labels, popups, or make the icons clickable.
- The 3D only really works at zoomed in scales 16+ due to the small size of the icons. They are not scale independent like icons on the normal map.
- As this uses the mapbox api you may wish to edit the index3d.html code to include your api key to remove any usage restrictions.
- This view is a side project to the Node-RED worldmap side project so happy to take PRs but it probably won't be actively developed.
If the payload contains an area property - that is an array of co-ordinates, e.g.
... , area: [ [51.05, -0.08], [51.5, -1], [51.2, -0.047] ], ...
then rather than draw a point and icon it draws the polygon. Likewise if it contains a line property it will draw the polyline.
- color : can set the colour of the polygon or line.
- fillColor : can set the fill colour of the polygon.
- fillOpacity : can set the opacity of the polygon fill colour.
- name : is used as the id key - so can be redrawn/moved.
- layer : declares which layer you put it on..
If the payload contains a radius property, as well as name, lat and lon, then rather than draw a point it will draw a circle. The radius property is specified in meters.
msg.payload = { lat:51.05, lon:-1.35, name:"A3090", radius:3000 }
As per Areas and Lines you may also specify color, fillColor, and layer.
If the payload contains a sdlat and sdlon property instead of radius an ellipse will be drawn. The sdlat and sdlon propertys specify the semi-axes of the ellipse. These are specified in the Latitude/Longitude format.
Areas, Lines and Circles can also specify more optional properties:
- color
- fillColor
- stroke
- weight
- opacity
- fill
- fillOpacity
- clickable (if true sets the passed in name as Popup)
A single right click will allow you to add a point to the map - you must specify the name and optionally the icon and layer.
Right-clicking on an icon will allow you to delete it.
If you select the drawing layer you can also add polylines, polygons and rectangles.
All these events generate messages that can be received by using a worldmap in node. Examples of messages coming FROM the map include:
{ "action": "connected" }
{ "action": "point", "lat": "50.60634", "lon": "-1.66580", "point": "joe,male,mylayer" }
{ "action": "delete", "name": "joe" }
{ "action": "layer", "name": "Esri Satellite" }
{ "action": "draw", "type": "rectangle", "points": [ { "lat": 50.61243889044519, "lng": -1.5913009643554688 }, { "lat": 50.66665471366635, "lng": -1.5913009643554688 }, { "lat": 50.66665471366635, "lng": -1.4742279052734375 }, { "lat": 50.61243889044519, "lng": -1.4742279052734375 } ] }
You can also control the map via the node, by sending in a msg.payload containing a command object.
Optional properties include
- lat - move map to specified latitude.
- lon - move map to specified longitude.
- zoom - move map to specified zoom level (1 - world, 13 to 20 max zoom depending on map).
- layer - set map to specified base layer name -
{command:{layer:"Esri"}} - search - search markers on map for name containing
string. If not found in existing markers, will then try geocoding looking using Nominatim. An empty string""clears the search results. -{command:{search:"Dave"}} - showlayer - show the named overlay(s) -
{command:{showlayer:"foo"}}or{command:{showlayer:["foo","bar"]}} - hidelayer - hide the named overlay(s) -
{command:{hidelayer:"bar"}}or{command:{hidelayer:["bar","another"}} - side - add a second map alongside with slide between them. Use the name of a baselayer to add - or "none" to remove the control. -
{command:{side:"Esri Satellite"}} - split - once you have split the screen - the split value is the % across the screen of the split line. -
{command:{split:50}} - map - Object containing details of a new map layer:
- name - name of the map base layer OR overlay - name of overlay layer
- url - url of the map layer
- opt - options object for the new layer
- wms - boolean, specifies if the data is provided by a Web Map Service
- bounds - sets the bounds of an Overlay-Image. 2 Dimensional Array that defines the top-left and bottom-right Corners (lat/lng Points)
- heatmap - set heatmap options object see https://github.com/Leaflet/Leaflet.heat#reference
- clear - layer name - to clear a complete layer and remove from layer menu
msg.payload.command = {layer:"Esri Satellite", lat:51, lon:3, zoom:10 };
msg.payload.command =  {
    name:"circle",
    lat:51.515,
    lon:-0.1235,
    radius:10,
    layer:"drawing",
    iconColor:'#464646',
    stroke:false,
    fillOpacity:0.8,
    clickable:true
};
The layer will be called name. By default it expects a leaflet Tilelayer style url. You can also use a WMS
style server by adding a property wms: true. (see overlay example below)
msg.payload.command.map = {
    name:"OSMhot",
    url:'http://{s}.tile.openstreetmap.fr/hot/{z}/{x}/{y}.png',
    opt:{ maxZoom:19, attribution:"© OpenStreetMap" }
};
To add an overlay instead of a base layer - specify the overlay property instead of the name.
msg.payload.command.map = {
    overlay: "NowCoast",
    url: 'https://nowcoast.noaa.gov/arcgis/services/nowcoast/radar_meteo_imagery_nexrad_time/MapServer/WmsServer?',
    opt:  {
        layers: '1',
        format: 'image/png',
        transparent: true,
        attribution: "NOAA/NWS"
    },
    wms: true
}
msg.payload.command.map = {
    overlay:"myGeoJSON",
    geojson:{ your geojson feature as an object },
    opt:{ optional geojson options, style, etc },
    fit:true
};
The geojson features may contain a properties property. That may also include a style with properties - stroke, stroke-width, stroke-opacity, fill, fill-opacity. Any other properties will be listed in the popup.
The opt property is optional. See the Leaflet geojson docs for more info on possible options. Note: only simple options are supported as functions cannot be serialised.
The fit property is optional. If present the map will automatically zoom to fit the area relevant to the geojson.
see http://leafletjs.com/examples/geojson/ for more details about options for opt.
As per the geojson overlay you can also inject a KML layer, GPX layer or TOPOJSON layer. The syntax is the same but with either a kml property containing the KML string - a gpx property containing a GPX string - or a topojson property containing the topojson.
msg.payload.command.map = {
    overlay:"myKML",
    kml:"<kml>...your kml placemarks...</kml>"
};
For GPX and KML layers, it is possible to define which icon to use for point markers by adding the
following properties to msg.payload.command.map:
- icon : font awesome icon name.
- iconColor : Standard CSS colour name or #rrggbb hex value.
Again the fit property can be added to make the map zoom to the relevant area.
msg.payload.command.map = {
    overlay:"myWind",
    velocity: {
        displayValues: true,
        displayOptions: {
            velocityType: 'Global Wind',
            displayPosition: 'bottomleft',
            displayEmptyString: 'No wind data'
        },
        maxVelocity: 15,
        data: [Array of data as per format referenced below]
    }
};
see https://github.com/danwild/leaflet-velocity for more details about options and data examples.
var imageBounds = [[40.712216, -74.22655], [40.773941, -74.12544]];
msg.payload = { command : {lat:40.74, lon:-74.175, zoom:13 } };
msg.payload.command.map = {
    overlay:"New York Historical",
    url:'http://www.lib.utexas.edu/maps/historical/newark_nj_1922.jpg',
    bounds: imageBounds,
    opt:{ opacity:1.0, attribution:"© University of Texas" }
};
msg.payload.command.clear = "name of your layer/overlay to remove";
IMHO the easiest map server to make work is the mapserver package in Ubuntu / Debian. Usually you will start with
sudo apt-get install mapserver-bin cgi-mapserver gdal-bin
Configuring that, setting up your tiles, and creating a .map file is way beyond the scope of this README so I will leave that as an exercise for the reader. Once set up you should have a cgi process you can run called mapserv, and a .map file that describes the layers available from the server.
Create and edit these into an executeable file called mapserv, located in this node's directory, typically
~/.node-red/node_modules/node-red-contrib-web-worldmap/mapserv, for example:
#! /bin/sh
# set this to the path of your WMS map file (which in turn points to your tiles)
MS_MAPFILE=~/Data/maps/uk.map
export MS_MAPFILE
# and set this to the path of your cgi-mapserv executable
/usr/bin/mapserv
You can then add a new WMS Base layer by injecting a message like
msg.payload.command.map = {
    name: "Local WMS",
    url: 'http://localhost:1880/cgi-bin/mapserv',   // we will serve the tiles from this node locally.
    opt: {
        layers: 'gb',                               // specifies a layer in your map file
        format: 'image/png',
        transparent: true,
        attribution: "© Ordnance Survey, UK"
    },
    wms: true                                       // set to true for WMS type mapserver
}
The following example gets recent earthquakes from USGS, parses the result, formats up the msg as per above and sends to the node to plot on the map. It also shows how to zoom and move the map or add a new layer.
[{"id":"86457344.50e6b","type":"inject","z":"745a133b.dd6dec","name":"","topic":"","payload":"","payloadType":"none","repeat":"","crontab":"","once":false,"x":190,"y":2420,"wires":[["9a142026.fa47f"]]},{"id":"9a142026.fa47f","type":"function","z":"745a133b.dd6dec","name":"add new layer","func":"msg.payload = {};\nmsg.payload.command = {};\n\nvar u = 'http://{s}.tile.openstreetmap.fr/hot/{z}/{x}/{y}.png';\nvar o = { maxZoom: 19, attribution: '© OpenStreetMap'};\n\nmsg.payload.command.map = {name:\"OSMhot\", url:u, opt:o};\nmsg.payload.command.layer = \"OSMhot\";\n\nreturn msg;","outputs":1,"noerr":0,"x":420,"y":2420,"wires":[["c643e022.1816c"]]},{"id":"c643e022.1816c","type":"worldmap","z":"745a133b.dd6dec","name":"","x":750,"y":2460,"wires":[]},{"id":"2998e233.4ba64e","type":"function","z":"745a133b.dd6dec","name":"USGS Quake monitor csv re-parse","func":"msg.payload.lat = msg.payload.latitude;\nmsg.payload.lon = msg.payload.longitude;\nmsg.payload.layer = \"earthquake\";\nmsg.payload.name = msg.payload.id;\nmsg.payload.icon = \"globe\";\nmsg.payload.iconColor = \"orange\";\n\ndelete msg.payload.latitude;\ndelete msg.payload.longitude;\t\nreturn msg;","outputs":1,"noerr":0,"x":540,"y":2560,"wires":[["c643e022.1816c"]]},{"id":"e72c5732.9fa198","type":"function","z":"745a133b.dd6dec","name":"move and zoom","func":"msg.payload = { command:{layer:\"Esri Terrain\",lat:0,lon:0,zoom:3} };\nreturn msg;","outputs":1,"noerr":0,"x":420,"y":2460,"wires":[["c643e022.1816c"]]},{"id":"12317723.589249","type":"csv","z":"745a133b.dd6dec","name":"","sep":",","hdrin":true,"hdrout":"","multi":"one","ret":"\\n","temp":"","x":390,"y":2500,"wires":[["2998e233.4ba64e"]]},{"id":"10e5e5f0.8daeaa","type":"inject","z":"745a133b.dd6dec","name":"","topic":"","payload":"","payloadType":"none","repeat":"","crontab":"","once":false,"x":190,"y":2460,"wires":[["e72c5732.9fa198"]]},{"id":"b6917d83.d1bac","type":"http request","z":"745a133b.dd6dec","name":"","method":"GET","url":"http://earthquake.usgs.gov/earthquakes/feed/v1.0/summary/2.5_day.csv","x":270,"y":2560,"wires":[["12317723.589249"]]},{"id":"3842171.4d487e8","type":"inject","z":"745a133b.dd6dec","name":"Quakes","topic":"","payload":"","payloadType":"none","repeat":"900","crontab":"","once":false,"x":200,"y":2500,"wires":[["b6917d83.d1bac"]]}]
Car icon made by Freepik from www.flaticon.com is licensed by CC 3.0 BY.