This project aims to (at least demonstrate) how to combine the Linux perf tool (aka perf_events) with viztracer to visualize the GIL (rather process states) and various profiling statistics, or hardware performance counters.
From PyPI
$ pip install per4m
Install perf
$ sudo yum install perf
Enable users to run perf (use at own risk)
$ sudo sysctl kernel.perf_event_paranoid=-1
Enable users to see schedule trace events:
$ sudo mount -o remount,mode=755 /sys/kernel/debug
$ sudo mount -o remount,mode=755 /sys/kernel/debug/tracing
We use uprobes to see who calls take_gil and drop_gil, so we need to add those uprobes manually:
sudo perf probe -f -x `which python` python:take_gil=take_gil
sudo perf probe -f -x `which python` python:take_gil=take_gil%return
sudo perf probe -f -x `which python` python:drop_gil=drop_gil
sudo perf probe -f -x `which python` python:drop_gil=drop_gil%return
It should give outlike like:
Failed to find "take_gil%return",
 because take_gil is an inlined function and has no return point.
Added new event:
  python:take_gil__return (on take_gil%return in /home/maartenbreddels/miniconda/envs/dev/bin/python3.7)
Check if this works
$ perf record -e python:take_gil__return -- python -c "import time; time.sleep(1)"
[ perf record: Woken up 1 times to write data ]
[ perf record: Captured and wrote 0,063 MB perf.data (563 samples) ]
In case you need to remove the uprobes:
$ sudo perf probe --del 'py*'
$ giltracer -m per4m.example2

[ perf record: Woken up 1 times to write data ]
[ perf record: Captured and wrote 0,044 MB perf-gil.data (116 samples) ]

Wait for perf to finish...
Loading finish
Saving report to /home/maartenbreddels/github/maartenbreddels/per4m/viztracer.json ...
Dumping trace data to json, total entries: 72, estimated json file size: 8.4KiB
Report saved.
perf script -i perf-gil.data --no-inline --ns | per4m perf2trace gil -i viztracer.json -o giltracer.json -q -v

Summary of threads:

    PID    total(us)    no gil%✅    has gil%❗    gil wait%❌
-------  -----------  -----------  ------------  -------------
2718963     267335     95.8333         0.353181        3.81349
2719035      56845.9    0.10576       54.7924         45.1019
2719036      57043.1    0.0279231     54.6021         45.37

High 'no gil' is good (✅), we like low 'has gil' (❗), and we don't want 'gil wait' (❌)

Wrote to giltracer.json
Saving report to /home/maartenbreddels/github/maartenbreddels/per4m/giltracer.html ...
Dumping trace data to json, total entries: 362, estimated json file size: 42.4KiB
Generating HTML report
Report saved.
This gives an overview of which threads held the GIL, and who needed to wait to get the GIL:
The giltracer.html file gives a visual overview of where a threads want to take the GIL, and where it has the GIL.

Instead of detecting the GIL, we can also look at process states, and see if and where processes sleep due to the GIL:
$ giltracer --no-gil-detect --state-detect -m per4m.example2
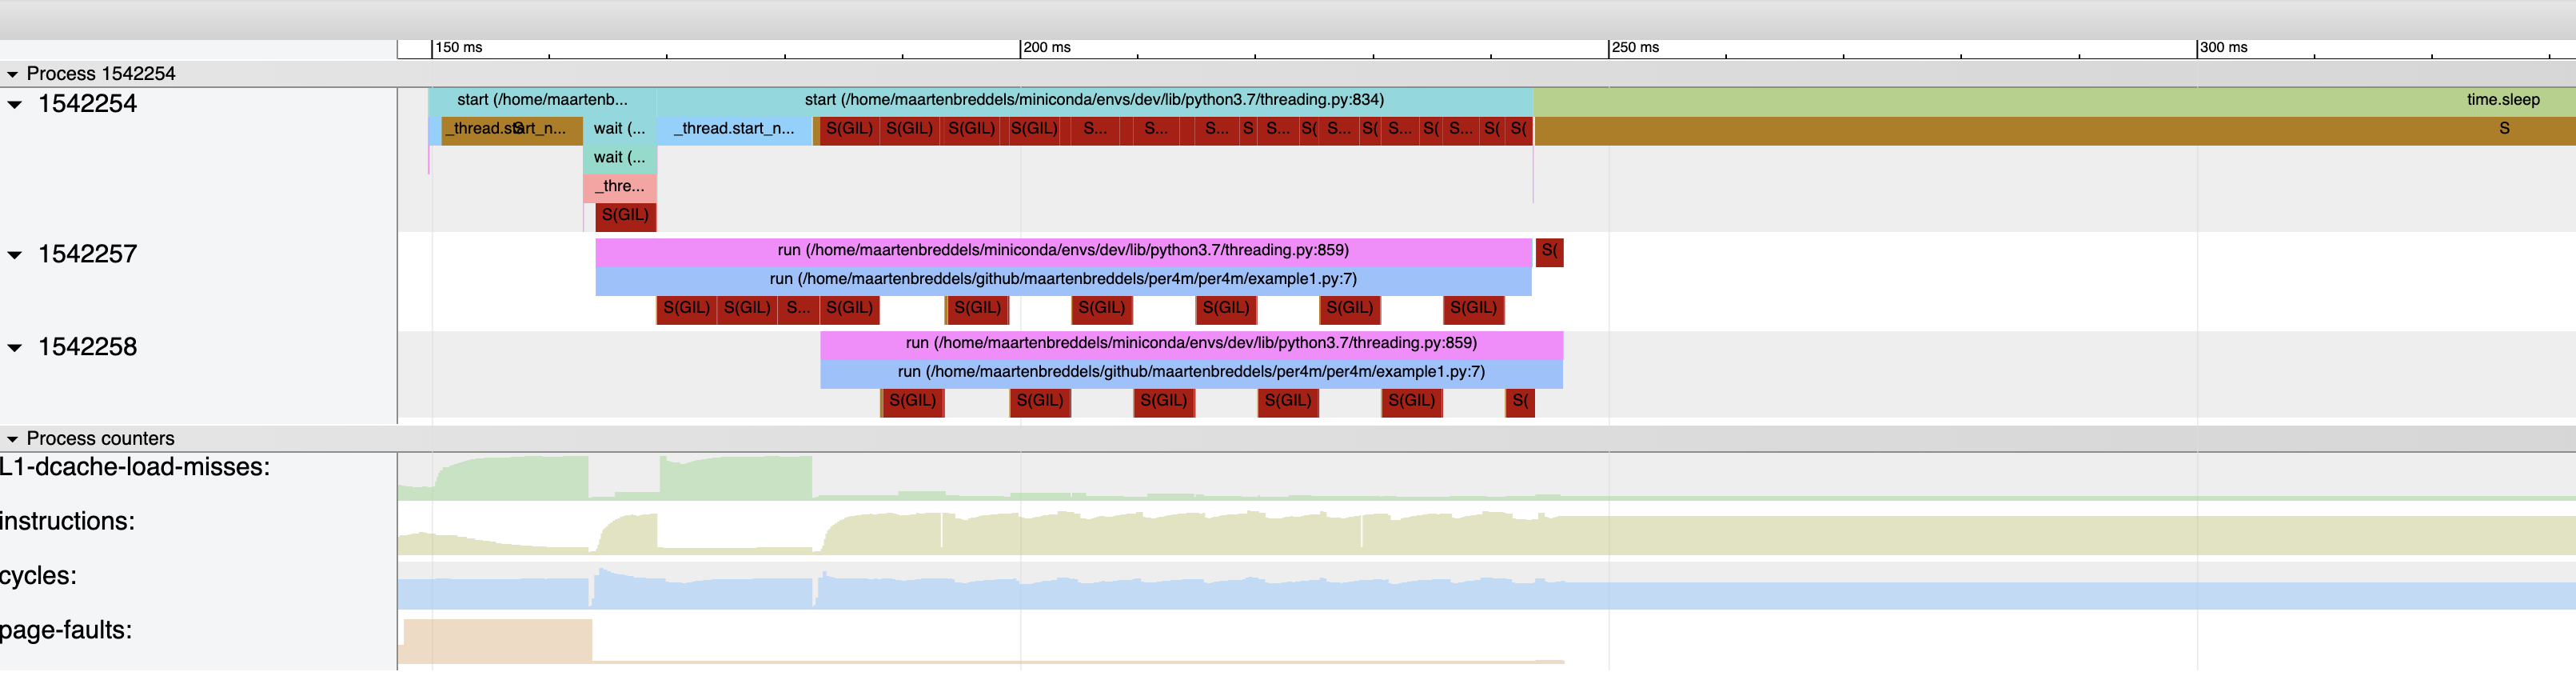
The dark red S(GIL) blocks indicate the threads/processes are in a waiting state due to the GIL, dark orange S is a due to other reasons (like time.sleep(...)). The regular pattern is due to Python switching threads after sys.getswitchinterval (0.005 seconds)
Although it is possible to do both:
$ giltracer --state-detect -m per4m.example2

This causes clutter, and perf often loses messages.
If you use NumPy, it will release the GIL, and you should see less waiting on the GIL, e.g the following should do much better.
# shows high gil load, but no wait
import threading
import numpy as np


N = 1024*1024*32
M = 4
x = np.arange(N, dtype='f8')

def some_numpy_computation():
    total = 0
    for i in range(M):
        total += x.sum()
    return total


thread1 = threading.Thread(target=some_numpy_computation)
thread2 = threading.Thread(target=some_numpy_computation)

def main(args=None):
    thread1.start()
    thread2.start()
    total = 0
    for i in range(1_000_000):
        total += i
    for thread in [thread1, thread2]:
        thread.join()
$ giltracer -m per4m.example3

[ perf record: Woken up 1 times to write data ]
[ perf record: Captured and wrote 0,045 MB perf-gil.data (112 samples) ]

Wait for perf to finish...
Loading finish
Saving report to /home/maartenbreddels/github/maartenbreddels/per4m/viztracer.json ...
Dumping trace data to json, total entries: 95, estimated json file size: 11.1KiB
Report saved.
perf script -i perf-gil.data --no-inline --ns | per4m perf2trace gil -i viztracer.json -o giltracer.json -q -v

Summary of threads:

    PID    total(us)    no gil%✅    has gil%❗    gil wait%❌
-------  -----------  -----------  ------------  -------------
2724006     109011        71.0196     28.668          0.312345
2724077      58313.4      90.3658      0.558379       9.07583
2724078      55886.6      92.3029      0.459127       7.23798

High 'no gil' is good (✅), we like low 'has gil' (❗), and we don't want 'gil wait' (❌)

Wrote to giltracer.json
Saving report to /home/maartenbreddels/github/maartenbreddels/per4m/giltracer.html ...
Dumping trace data to json, total entries: 375, estimated json file size: 43.9KiB
Generating HTML report
Report saved.
We see that the two threads waiting on the GIL just 10% of the time (room for improvement, left as an excercise for the reader).

Analougous to Brendan Gregg's off cpu analysis we'd like to know in Python who is waiting for the GIL, and we also want to see the the C stacktrace and possibly what the kernel is doing.
Note that we we are looking at stacktraces that are both off cpu and off gil (since off gil but on cpu should be good).
$ offgil | ~/github/FlameGraph/stackcollapse.pl | ~/github/FlameGraph/flamegraph.pl --countname=us --title="Off-GIL Time Flame Graph" --colors=python > offgil.svg

Or, if you'd like to see the CPython evaluation stacktraces, and what happens in the kernel:
$ offgil --no-strip-take-gil --keep-cpython-evals | ~/github/FlameGraph/stackcollapse.pl | ~/github/FlameGraph/flamegraph.pl --countname=us --title="Off-GIL Time Flame Graph" --colors=python > offgil.svg
We see that NumPy has trouble returning to Python land because the main thread has the GIL locked.

First, load the magics
%load_ext per4m
Run a cell with the %%giltracer cell magic.
%%giltracer
import threading
import time
import time


def run():
    total = 0
    for i in range(1_000_000):
        total += i
    return total


thread1 = threading.Thread(target=run)
thread2 = threading.Thread(target=run)
thread1.start()
thread2.start()
time.sleep(0.2)
for thread in [thread1, thread2]:
    thread.join()
Output:
Saving report to /tmp/tmp2rwf1xq3/viztracer.json ...
Dumping trace data to json, total entries: 89, estimated json file size: 10.4KiB
Report saved.

[ perf record: Woken up 8 times to write data ]
[ perf record: Captured and wrote 2,752 MB /tmp/tmp2rwf1xq3/perf.data (415 samples) ]

Wait for perf to finish...
Saving report to /home/maartenbreddels/github/maartenbreddels/per4m/result.html ...
Dumping trace data to json, total entries: 167, estimated json file size: 19.6KiB
Generating HTML report
Report saved.
Download viztracer.html
Open viztracer.html in new tab (might not work due to security issue)
Click the download link to get the results.
Create a script that uses viztracer to store trace information:
import threading
import time
import viztracer
import time


def run():
    total = 0
    for i in range(1_000_000):
        total += i
    return total


with viztracer.VizTracer(output_file="example1.json"):
    thread1 = threading.Thread(target=run)
    thread2 = threading.Thread(target=run)
    thread1.start()
    thread2.start()
    time.sleep(0.2)
    for thread in [thread1, thread2]:
        thread.join()
Run and trace scheduler events from the kernel (to capture GIL information) and measure hardware performance counters
$ perf record -e 'sched:*' --call-graph dwarf -k CLOCK_MONOTONIC -e L1-dcache-load-misses -e instructions -e cycles -e page-faults -- python -m per4m.example1
Loading finish
Saving report to /home/maartenbreddels/github/maartenbreddels/per4m/example1.json ...
Dumping trace data to json, total entries: 76, estimated json file size: 8.9KiB
Report saved.
[ perf record: Woken up 139 times to write data ]
[ perf record: Captured and wrote 26,139 MB perf.data (3302 samples) ]
Convert perf.data to Trace Event Format
$ perf script --no-inline | per4m perf2trace --no-running -o example1perf.json
Merge the viztracer and perf/per4m results into a single html file.
$ viztracer --combine example1.json example1perf.json -o example1.html
Even though a thread may have a lock on the GIL, if other don't need it, it's fine. For instance, using gil_load:
$ python -m gil_load per4m/example3.py
eld: 1.0 (1.0, 1.0, 1.0)
wait: 0.083 (0.083, 0.083, 0.083)
  <139967101757248>
    held: 1.0 (1.0, 1.0, 1.0)
    wait: 0.0 (0.0, 0.0, 0.0)
  <139957774272256>
    held: 0.0 (0.0, 0.0, 0.0)
    wait: 0.083 (0.083, 0.083, 0.083)
  <139957765879552>
    held: 0.0 (0.0, 0.0, 0.0)
    wait: 0.083 (0.083, 0.083, 0.083)
Show one thread that has a high GIL load, but it does not keep the others from running (except 8% of the time), i.e. wait is low (see example3.py). We can visualize this using giltracer (not that we import numpy and some other modules before tracing to avoid clutter)
$ per4m giltracer --import="numpy,threading,time,gil_load" -m per4m.example3

In case you are interested in using uprobes yourself, this is how you use it:
$ perf record -e 'python:*'  -- time python -m per4m.example3
1.73user 3.44system 0:00.95elapsed 544%CPU (0avgtext+0avgdata 297224maxresident)k
0inputs+0outputs (0major+6393minor)pagefaults 0swaps
[ perf record: Woken up 4 times to write data ]
[ perf record: Captured and wrote 0,969 MB perf.data (12217 samples) ]
And see what we got:
$ perf script --no-inline | tail
          python 2397983 [058] 3846350.744446: python:take_gil__return: (563fc316fcc0 <- 563fc315691f)
          python 2397982 [057] 3846350.749502: python:take_gil__return: (563fc316fcc0 <- 563fc315691f)
          python 2397983 [058] 3846350.754557: python:take_gil__return: (563fc316fcc0 <- 563fc315691f)
          python 2397982 [057] 3846350.759612: python:take_gil__return: (563fc316fcc0 <- 563fc315691f)
          python 2397983 [058] 3846350.764668: python:take_gil__return: (563fc316fcc0 <- 563fc315691f)
          python 2397982 [057] 3846350.769725: python:take_gil__return: (563fc316fcc0 <- 563fc315691f)
          python 2397983 [058] 3846350.772506: python:take_gil__return: (563fc316fcc0 <- 563fc315691f)
          python 2397918 [056] 3846350.777600: python:take_gil__return: (563fc316fcc0 <- 563fc309a0b4)
          python 2397983 [058] 3846350.777614: python:take_gil__return: (563fc316fcc0 <- 563fc315691f)
          python 2397918 [056] 3846350.842284: python:take_gil__return: (563fc316fcc0 <- 563fc309a0b4)
And we see the two threads exchanging the GIL at about every 0.005 seconds.