Covid Control is a machine learning model free and assessible that predicts the future number of Covid19 Daily Cases (7-day moving average). Quantifying Non-Pharmaceutical Interventions (NPIs) using LSTM and Reinforcement Learning. Using machine learning to save lives in humanity's unprecedented global health emergy Novel Coronavirus (COVID-19) to help flatten the curve. Development of a data-driven AI systems to predict infection rates and prescribe Intervention Plans (IPs) that regional governments, communities, and organizations can implement. Intervention plans can result in reducing infection cases, minimizing negative economic impacts, and better outcomes when countries reopen their economies and societies.


3Blue1Brown's "Exponential growth and epidemics" Covid19 video:
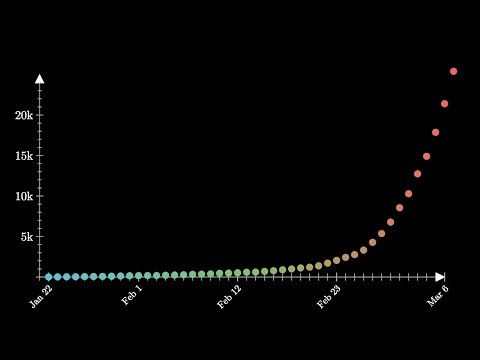
The goal is to develop a machine learning model to predict the future number of Covid Cases worldwide:
Part1 Predictor: LSTM Long Short-Term Memory Predictor Model
- Estimates future numbers of daily COVID-19 cases with the greatest accuracy using LSTM Long Short-Term Memory and developed a predictor model that estimates the number of future cases for a given region considering the local intervention plans
- Quantifying Non-Pharmaceutical Interventions (NPIs) using LSTM layers
- Examples of NPIs include lockdowns, social distancing, and the mandatory use of face masks and careful hand hygiene
- Vaccine or antiviral are not NPIs.
Part2 Prescriptor: RL Effective Reinforcement Learning through Evolutionary Surrogate-Assisted Prescription (ESP)
- Produce the best prescription models for Intervention Plans. Implementation of the paper "From Prediction to Prescription: Evolutionary Optimization of Non-Pharmaceutical Interventions in the COVID-19 Pandemic".
Based on knowledge of the populations and the epidemic, and the data so far about its progress in different populations and efforts to contain it, Covid Control can estimate how the disease will progress in the future using Cognizant's Evolutionary AI.
-
Cognizant’s Learning Evolutionary Algorithm Framework (LEAF) uses advanced evolutionary algorithms and deep learning to produce actionable results from complicated, multivariate problems.
-
The Evolutionary Surrogate-Assisted Prescription (ESP) system learned to make recommendations about the spread of COVID-19. ESP’s two learning tasks include:
- Learning to predict
- Using the predictor as a surrogate for the real world to prescribe actions that lead to desirable outcomes.
-
Evolutionary Surrogate-Assisted Prescription (ESP)
- Surrogate is for example, a random forest or a neural network trained with gradient descent
- Neural network that is evolved to maximize the predictions of the surrogate model.
- The evolutionary algorithms process generations of variable combinations very quickly.
- The least-useful-candidates are discarded and new ones are generated from variants of the most-useful-candidates through recombination and mutation.
Explainable Artificial Intelligence (XAI)
-
Explainable AI (XAI) is the class of systems that provide visibility into how an AI system makes decisions and predictions and executes its actions. XAI explains the rationale for the decision-making process, surfaces the strengths and weaknesses of the process, and provides a sense of how the system will behave in the future.
-
It contrasts with the concept of the "black box" in machine learning where even their designers cannot explain why the AI arrived at a specific decision. The term "glass box" has also been used to systems that monitor the inputs and outputs of a system, with the purpose of verifying the system's adherence to ethical and socio-legal values and, therefore, producing value-based explanations.
-
Inherently Interpretable Models vs. Black-Box Deep Learning Models
-
The technical challenge of explaining AI decisions is sometimes known as the interpretability problem where the interpretable models (which were very small linear models or logical models in these studies) performed just as well as the more complicated (black box) machine learning models
-
No matter whether we used a deep neural network or classical statistical techniques for linear models, we found that there was less than a 1% difference in accuracy between the methods, which is within the margin of error caused by random sampling of the data.
-
Accuracy–interpretability tradeoff is revealed to be a fallacy such that more interpretable models often become more accurate.
-
-
The Oxford Covid-19 Government Response Tracker (OxCGRT) collects publicly available information on 19 indicators of government response and includes statistics on the number of reported Covid-19 cases and deaths in each country. There are 11 indicators of government response, such as school closings, travel bans, or other measures. For a full description of the data and how they are collected, see https://www.bsg.ox.ac.uk/research/publications/variation-government-responses-covid-19
-
These can range from huge amounts of missing data (that are not missing at random), or unmeasured confounding, to systematic errors in the dataset (e.g., incorrect coding of drug treatments), to data collection issues that cause the distribution of data to be different than what we originally thought.
Other factors that can have a measurable impact on the spread of the virus that I did not have time to implement in the model:

-
Number of hospital beds per 1000 people for each country: https://www.kaggle.com/hamzael1/hospital-beds-by-country or https://www.kaggle.com/ikiulian/global-hospital-beds-capacity-for-covid19
- Number of ICU beds per county/state: https://www.kaggle.com/jaimeblasco/icu-beds-by-county-in-the-us
-
Visualization https://www.kaggle.com/ikiulian/simple-global-countries-visualization
-
Weather data https://www.kaggle.com/johnjdavisiv/us-counties-covid19-weather-sociohealth-data
- Seasonality and monthly temperature
- Impact of temperature and humidity on transmission rate https://www.kaggle.com/noaa/gsod
- Joined each region in the Johns Hopkins University data to the nearest weather station
-
Compare Covid dataset with past pandemics:
-
Twitter sentiment analysis
- Covid tweets Datasets http://www.lix.polytechnique.fr/dascim/software_datasets/projects/covid-twitter-analytics/
- Regional covid twitter sentiments
-
Economic indicators
- Unemployment, consumer spending, and GNP.
- The World Bank's World Development Indicators https://www.kaggle.com/theworldbank/world-development-indicators
-
Social dynamics between vulnerable groups affects transmissions.
- For instance in the case of HIV, mixing and contact depends on age groups.
-
Release of measures like stimulus checks affecting
-
Confidence intervals, death rates, hospitalizationrates, ventilators needed.
-
Coronavirus Retail Restrictions by region https://nrf.com/coronavirus-retail-restrictions-state
-
Air conditioning and Covid spread
-
Number of seated resturant diners at restaurants per day since the end of February https://www.kaggle.com/jaimeblasco/opentable-state-of-the-restaurant-industry
-
Air transport, passengers carried
-
GDP per capita, PPP (current international $)
-
International migrant stock, total, International tourism, number of arrivals, International tourism, number of departures
-
Labor force participation rate, total (% of total population ages 15+) (modeled ILO estimate)
-
Mortality rate attributed to household and ambient air pollution, age-standardized (per 100,000 population), and Mortality rate attributed to unsafe water, unsafe sanitation and lack of hygiene (per 100,000 population)
-
Number of Nurses and midwives (per 1,000 people)
-
People using at least basic sanitation services (% of population), People using safely managed sanitation services (% of population), and People with basic handwashing facilities including soap and water (% of population)
-
Number of Physicians (per 1,000 people)
-
PM parts million 2.5 air pollution, population expoled to levels exceeding WHO guideline value (% of total)
-
Poverty headcount ratio at $3.20 a day (2011 PPP) (% of population)
-
How long does someone with COVID-19 typically stay on a ventilator? Some people may need to be on a ventilator for a few hours, while others may require one, two, or three weeks. If a person needs to be on a ventilator for a longer period of time, a tracheostomy may be required. During this procedure, a surgeon makes a hole in the front of the neck and inserts a tube into the trachea.
-
N95 masks can be rotated every 3–4 days, heated for 60 min, steamed or boiled for 5 min, and then air-dried. These methods retain 92.4–98.5% filtering efficiency (FE). Using soap and water or medical grade alcohol significantly decreases the FE of the masks (54% and 67%, respectively).
-
Can a person become re-infected with COVID-19 within 3 months of recovery? Review of currently available evidence suggests that most individuals do not become re-infected within 3 months of resolution of SARS-CoV-2 infection.
-
14 day self-quarantine. You should still self-quarantine for 14 days since your last exposure. It can take up to 14 days after exposure to the virus for a person to develop COVID-19 symptoms. A negative result before end of the 14-day quarantine period does not rule out possible infection. By self-quarantining for 14 days, you lower the chance of possibly exposing others to COVID-19.
-
Contact Tracing Apps. Contact tracing is an effective disease control strategy that involves identifying cases and their contacts then working with them to interrupt disease transmission. This includes asking cases to isolate and contacts to quarantine at home voluntarily. Contact tracing is a key strategy to prevent the further spread of COVID-19.
-
Incubation Time Period matters where a person develops symptoms 5 days after being infected, but symptoms can appear as early as 2 days after infection or as late as 14 days after infection, and the time range can vary.
-
It typically takes a few weeks for the body to build immunity after vaccination. That means it's possible a person could be infected with the virus that causes COVID-19 just before or just after vaccination and get sick. This is because the vaccine has not had enough time to provide protection.
-
Number of Critical Covid cases where in critical covid cases (~5% of total cases) the infection can damage the walls and linings of the air sacs in your lungs. As your body tries to fight it, your lungs become more inflamed and fill with fluid. This can make it harder for them to swap oxygen and carbon dioxide.
-
Two-week delay between the time a person is infected and the time the case is detected. A similar delay can therefore be expected between the time an NPI is put in places and its effect on the number of cases.
-
Vaccination Data
- Tracking COVID-19 vaccination rates:https://ourworldindata.org/covid-vaccinations
- Vaccine development: vaccines approved for use and in clinical trials
- Vacine canidates, trial deadlines, vacine diswtrubution, vacine implementation

-
An LSTM neural network model is trained with publicly available data on infections and NPIs in a number of countries and applied to predicting how the pandemic will unfold in them in the future. The predictions are cascaded one day at a time and constrained to a meaningful range. Using the data-driven LSTM model as the Predictor, a Prescriptor is evolved in a multi-objective setting to minimize the number of COVID-19 cases, as well as the number and stringency of NPIs (representing economic impact).
-
Keras representation of the learnable predictor model with LSTM example 'data' directory
- The previous 21 days are fed into the context input; the previous 21 days of stringency values for the eight NPIs are fed into the action input.
- The Lambda layer combines the context branch h and the action branch g to produce prediction Rˆn.
- The effects of social distancing and endogenous growth rate of the pandemic are processed in separate pathways, making it possible to ensure that stringency has a monotonic effect, resulting in more regular predictions.
Eight NPIs were used to train the Predictor model. Values range from 0 for no measures to 2, 3, or 4 for full measures:
- Schools closing [important]
- Workplace closing [important]
- Cancel public events
- Restrictions on gatherings
- Close public transport
- Stay at home requirements
- Restrictions on internal movements travel between regions/cities
- International travel controls
Phase 2: Effective Reinforcement Learning through Evolutionary Surrogate-Assisted Prescription (ESP)
-
Reinforcement learning (RL) where models makes sequential decision-making tasks with weight parameters. This is used in Decision optimization in real-world problems
-
Surrogate technique that combines evolutionary search with surrogate modeling. Implementation of the paper https://arxiv.org/pdf/2002.05368.pdf
- Evolve a decision strategy that optimizes the outcomes
- Example surrogate == a random forest or a neural network trained with gradient descent, and the strategy is a neural network that is evolved to maximize the predictions of the surrogate model.
- Majority of evaluations are done on the surrogate
- ESP is more sample efficient, has lower variance, and lower regret than standard RL approaches
-
ESP is a continuous black-box optimization process for adaptive decision-making where the predictor takes a decision as its input, and predicts the outcomes of that decision. A decision consists of a context and actions to be taken in that context as shown below in the diagram:

- Use historical data available on decision making in organizations, consisting of the decision problem, what decisions were made, and how desirable the outcomes were
- In the NPI optimization task, ESP is built to prescribe the NPIs for the current day such that the number of cases and cost that would result in the next two weeks is optimized.
Amazon Web Services Training


Evaluation Sandbox
- Upload predictor models to evaluate models through an automated robojudge where predictor must return a prediction in less than 1 hour for up to 180-days of prediction for up to 300 regions when it is called:
- OS: Ubuntu Bionic 18.04
- CPU: 2
- RAM: 8 Gb
- Evaluation Sandbox Request Instructions https://docs.google.com/document/d/1rTSyuA5HFkpyH-jn9Z-bAtHIMyflKzvLilwA_xNwNxc/edit
- Team Covid Control's Sandbox
- A predictor is accessed through a script in the evaluation sandbox. The predictor must be called with a single command with the following exact syntax and arguments:
python predict.py -s start_date -e end_date -ip path_to_ip_file -o path_to_output_file

The ESP algorithm then operates as an outer loop that constructs the Predictor and Prescriptor models:
- Train a Predictor based on historical training data;
- Evolve Prescriptors with the Predictor as the surrogate;
- Apply the best Prescriptor in the real world;
- Collect the new data and add to the training set;
- Repeat.
The data from submissions will be ranked in each region according to the cumulative error in the 7-day moving average for the number of cases per 100,000 people. Two overall performance measures will be formed:
-
Mean ranking of teams across all regions
-
Mean ranking of teams across the specialty regions, if selected
-
These baselines included linear regression, random forest regression (RF), support vector regression (SVR) with an RBF kernel, and feed-forward neural network regression (MLP). Each baseline was implemented with sci-kit learn, using their default parameters.
-
The model was trained until validation MAE did not improve for 20 epochs, at which point the weights yielding the best validation MAE were restored. Since the model and dataset are relatively small compared to common deep learning datasets, the model is relatively inexpensive to train. On a 2018 MacBook Pro Laptop with six Intel i7 cores, the model takes 276 ± 31 seconds to train (mean and std. err. computed over 10 independent training runs).
-
NPI-LSTM outperforms the baselines on all metrics. The simple linear model outperforms them substantially on the metrics that require forecasting beyond a single day, showing the difficulty that off-the-shelf nonlinear methods have in handling such forecasting.

For each day in the 180-day evaluation period, the prescriptor is called with the date and weights as specified above, obtaining prescriptions for each region. They are evaluated along the two objectives:
- The standard predictor is called to estimate the number of cases for each region; and
- The total intervention plan stringency is calculated for each region using the Oxford University Blavatnik School of Government’s COVID-19 Government Response Tracker Stringency Index formula, with the specified weights for the region.
The weights for each region are drawn from a uniform distribution within [0..1] and normalized to sum up to one. The process is repeated three times with different weights and the results are averaged. The same three sets of weights are used to evaluate all prescriptors. Additionally, a case where all weights are equal is used as a separate base-case evaluation. The predictions and stringency will be averaged over the 180-day period to obtain the final objective values (i.e., cases and stringency) for the prescriptor for each region. Results with both the base case (with equal weights) and the general case (with random weights) were presented to the judges as the outcome of the first quantitative evaluation.

An important aspect of any decision system is to make it trustworthy, i.e. estimate confidence in its decisions and predictions, allow users to utilize their expert knowledge and explore alternatives, and explain the decision recommendations. The first step was already taken in this study by applying the RIO uncertainty estimation method to the predictions. This approach may be improved in the future by grouping the countries according to original predictor performance, then training a dedicated RIO model for each group. In this way, each RIO model focuses on learning the predictive uncertainty of countries with similar patterns, so that the estimated confidence intervals become more reliable. As a further step, the estimated uncertainty can be used by the Prescriptor to make safer decisions.
The historical cases are not explicitly an input to the predictor. The predictor can save and access the historical case data up to the starting point of the evaluation in the evaluation sandbox work folder. It can then use its own predictions in lieu of actual cases for the active evaluation period. In this manner, its predictions can be based on parallel time series of case history and intervention plan history up to the current point in time.

Three types of tests:
- Tests on historic data to see the performance of the model
- Tests on data from Dec 22nd to Jan 11th -- to see the performance in the 'near future' and be able to validate it with the real data
- Tests of hypothetical future scenarios (beyond Jan 11th) where they will create different NPIs scenarios and they want to see how the models perform
Sanity checks:
- Ranking on retrospective runs on historical intervals, representing a broader range of situations than encountered in live testing
- Other predictor sanity check pass/fail results (e.g., negative predictions, maximal and minimal stringency predictions, and predictions exceeding population size)
Mean Absolute Error (MAE):
- The evaluation metric for this competition is Mean Absolute Error (MAE). The MAE metric takes the differences in all of the predicted and actual prices, adds them up and then divides them by the number of observations
- If you rank higher will have a lower score on the metric, which means they incurred fewer errors you should aim for the minimum MAE
- Exponential growth and epidemics https://www.youtube.com/watch?v=Kas0tIxDvrg&feature=emb_title&ab_channel=3Blue1Brown
- Evolutionary Surrogate-assisted Prescription https://www.youtube.com/watch?v=w-QzHIArrFg&ab_channel=USCISI
- Modeling COVID-19 scenarios for the United States https://www.nature.com/articles/s41591-020-1132-9
- Amazon's AWS COVID-19 Knowledge Graph (CKG) and CORD-19 ranking and recommendation system https://www.amazon.science/blog/using-knowledge-graphs-to-streamline-covid-19-research
- COVID19 Global Forecasting https://www.kaggle.com/c/covid19-global-forecasting-week-5/data
- Paper. From Prediction to Prescription: Evolutionary Optimization of Non-Pharmaceutical Interventions in the COVID-19 Pandemic https://arxiv.org/pdf/2005.13766.pdf
- Evolutionary Neural AutoML for Deep Learning https://arxiv.org/pdf/1902.06827.pdf
- Addressing the business challenges presented by the coronavirus. https://home.kpmg/xx/en/home/insights/2020/03/the-business-implications-of-coronavirus.html
- Preparing first responders, healthcare providers, and health systems https://www.cdc.gov/coronavirus/2019-ncov/cdcresponse/index.htmlhttps://www.cdc.gov/coronavirus/2019-ncov/cdcresponse/index.html
- Scientific information about the 2019 novel Coronavirus https://www.ncbi.nlm.nih.gov/research/coronavirus/
- Novel Coronavirus Outbreak https://novel-coronavirus.onlinelibrary.wiley.com/
- Coronavirus (COVID-19) Research Highlights https://www.springernature.com/gp/researchers/campaigns/coronavirus
- Evolutionary AI: Go Beyond Prediction with LEAF https://www.cognizant.com/aicom/documents/cognizant-sentient-leaf-offering-overview.pdf
- Access to OUP resources on COVID-19 https://academic.oup.com/journals/pages/coronavirus
- Elsevier Coronavirus Research Repository https://coronavirus.1science.com/search
- Explainable artificial intelligence https://en.wikipedia.org/wiki/Explainable_artificial_intelligence
- Glass-Box Models: A Gentle Introduction https://medium.com/@alkali.app/glass-box-models-a-gentle-introduction-2f39589c09d1
- Why Are We Using Black Box Models in AI When We Don’t Need To? A Lesson From An Explainable AI Competition https://hdsr.mitpress.mit.edu/pub/f9kuryi8/release/6
- Why asking an AI to explain itself can make things worse https://www.technologyreview.com/2020/01/29/304857/why-asking-an-ai-to-explain-itself-can-make-things-worse/
- Augmenting Human Decision Making Optimizing COVID-19 Interventions https://evolution.ml/esp/npi/