Lorena Abad
Showcasing the possibilities of using ggraph with a layout that
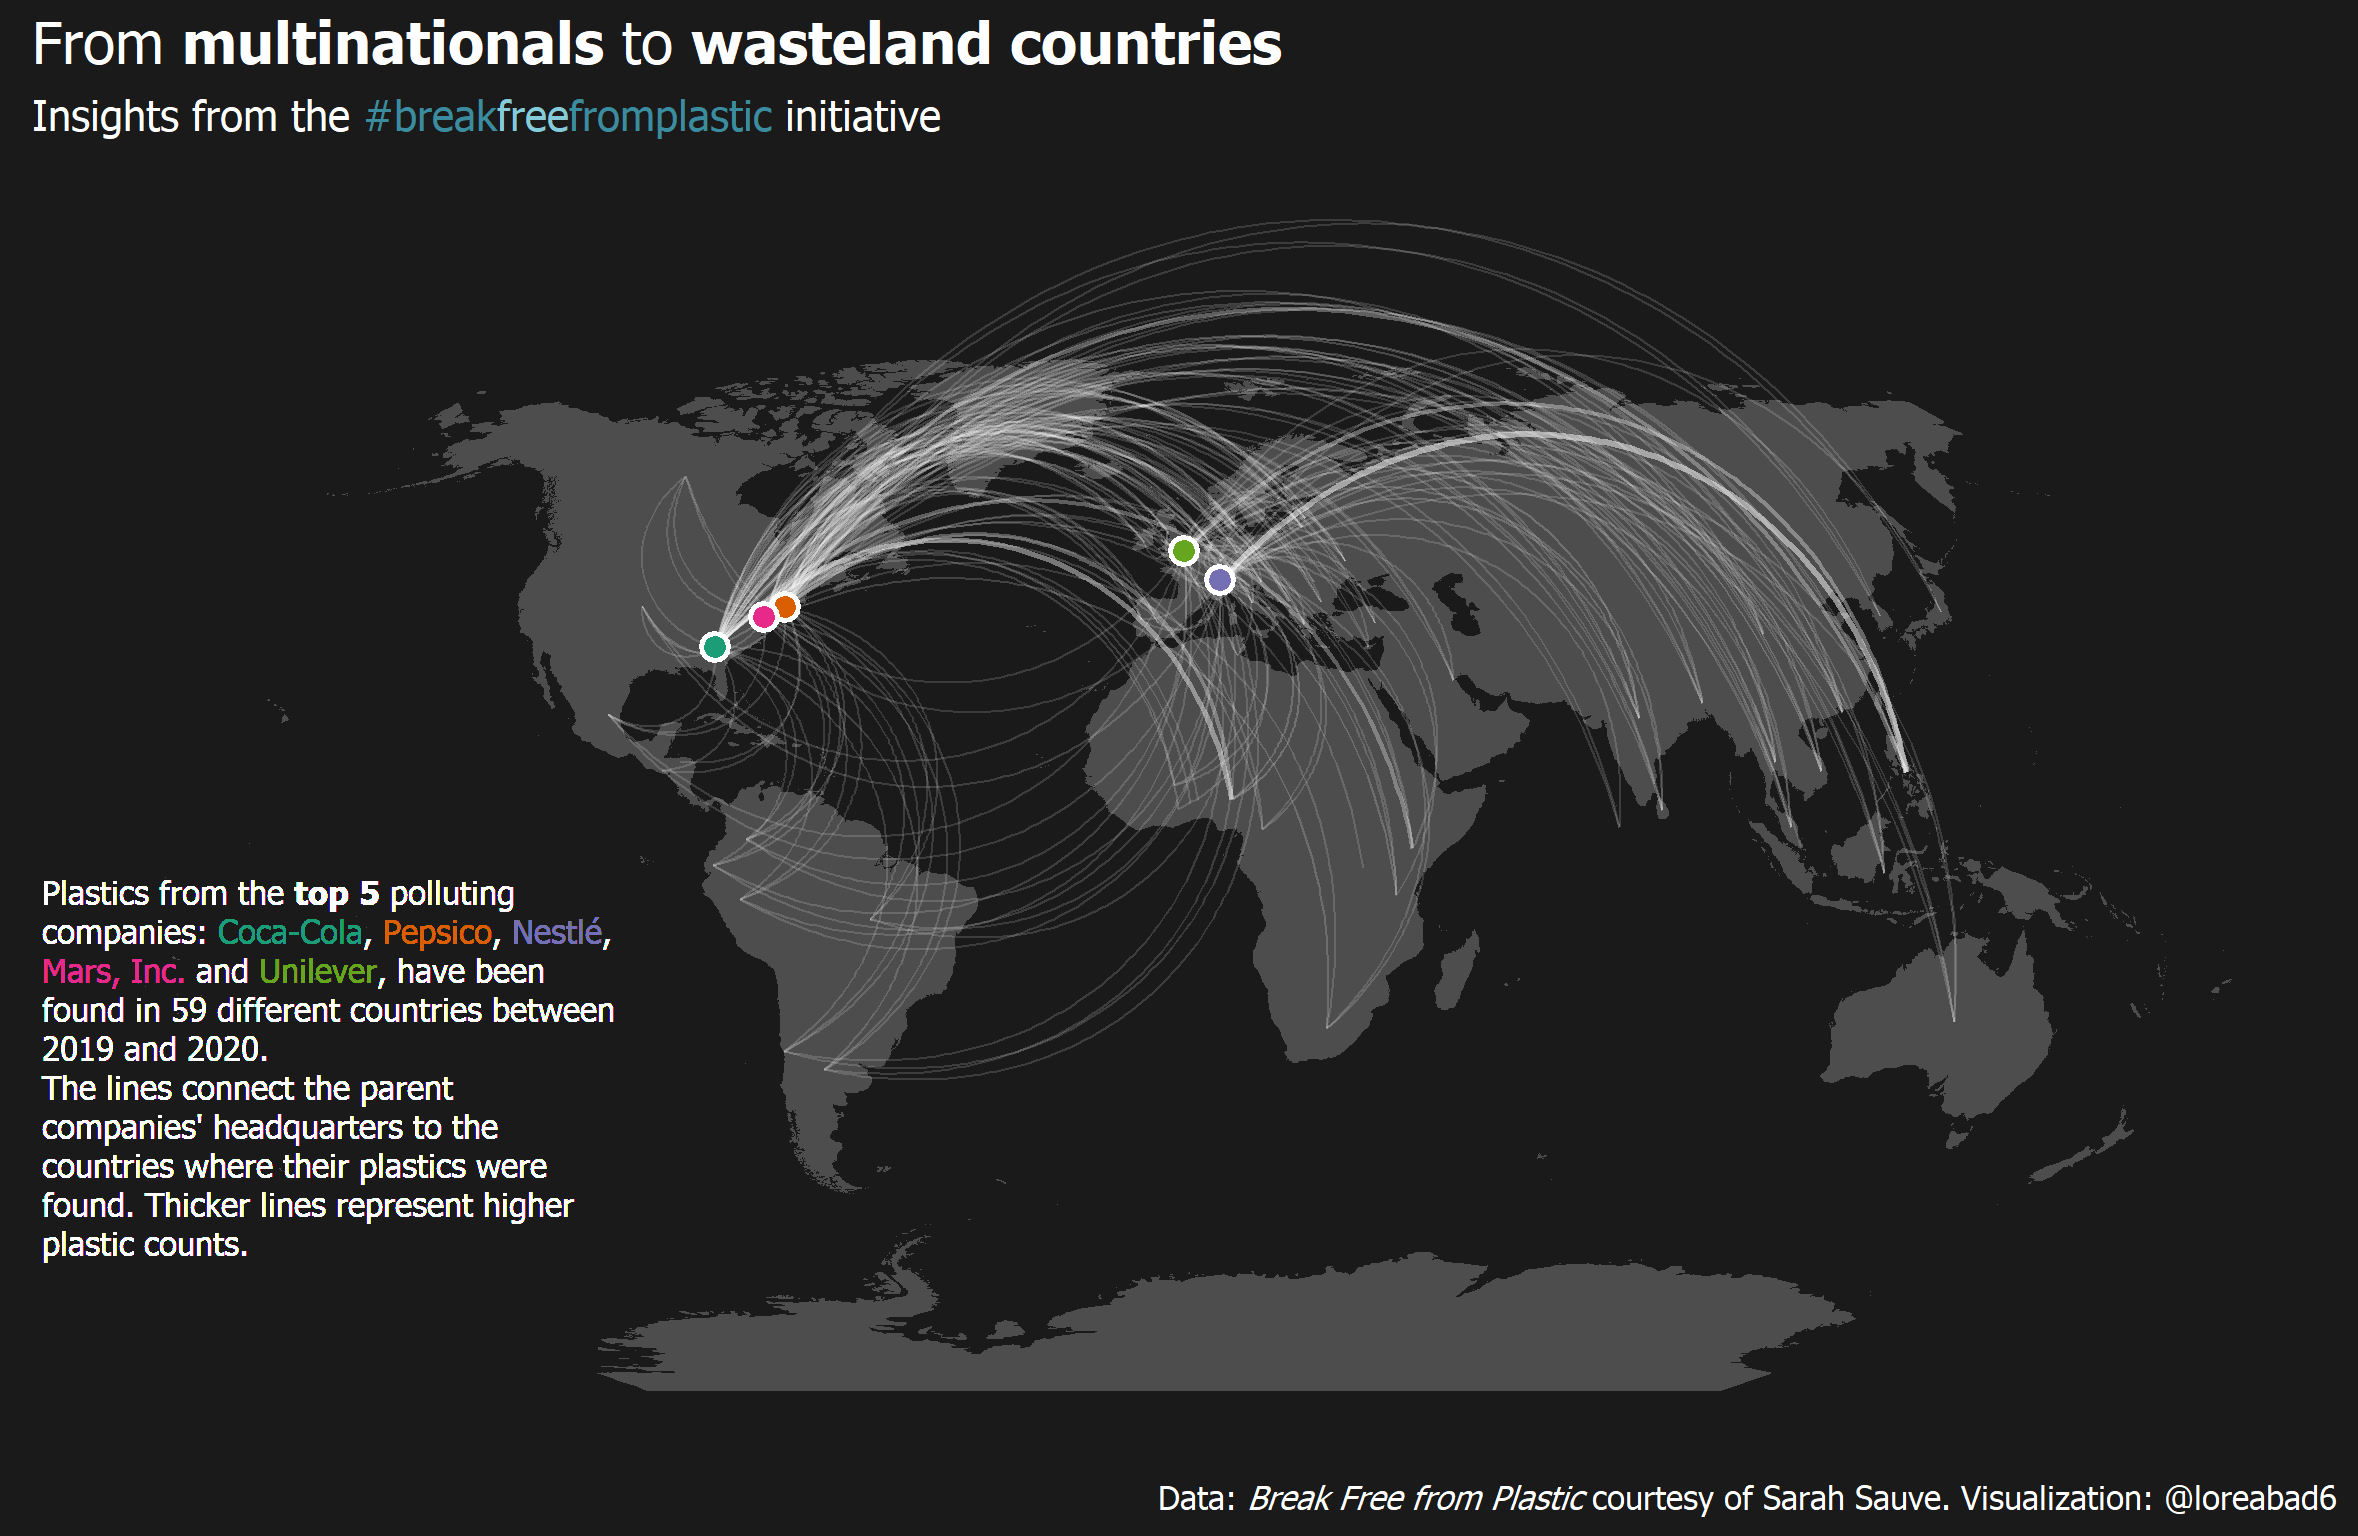
understands geographical space positions via sf. These examples use
sfnetworks and my implementation of ggraph still under construction
before a PR is possible, and can be installed as:
remotes::install_github("loreabad6/ggraph")The data used here comes from the Tidy Tuesday weekly data project. This is week 5 of 2021 were we analyzed data from the “Break Free from Plastic” initiative. Have a look at the final plot:
Here is a step by step guide on how to recreate it.
This example is inspired on this wonderful blogpost on Network Visualization by Katherine Ognyanova, where I tried to recreate the last plot.

Code here.
In his very helpful
blogpost
Markus Neteler (@internaut) guides us through three different ways to
plot a spatial graph on a map. With the ggraph and sfnetworks
combination, we can add a fourth way!

Code here.
Examples of what can be done with the sfnetworks package is shown
here, with all the figures created with ggraph and ggplot2!

To create this GIF I used xaringan and you can find the raw .Rmd
file here