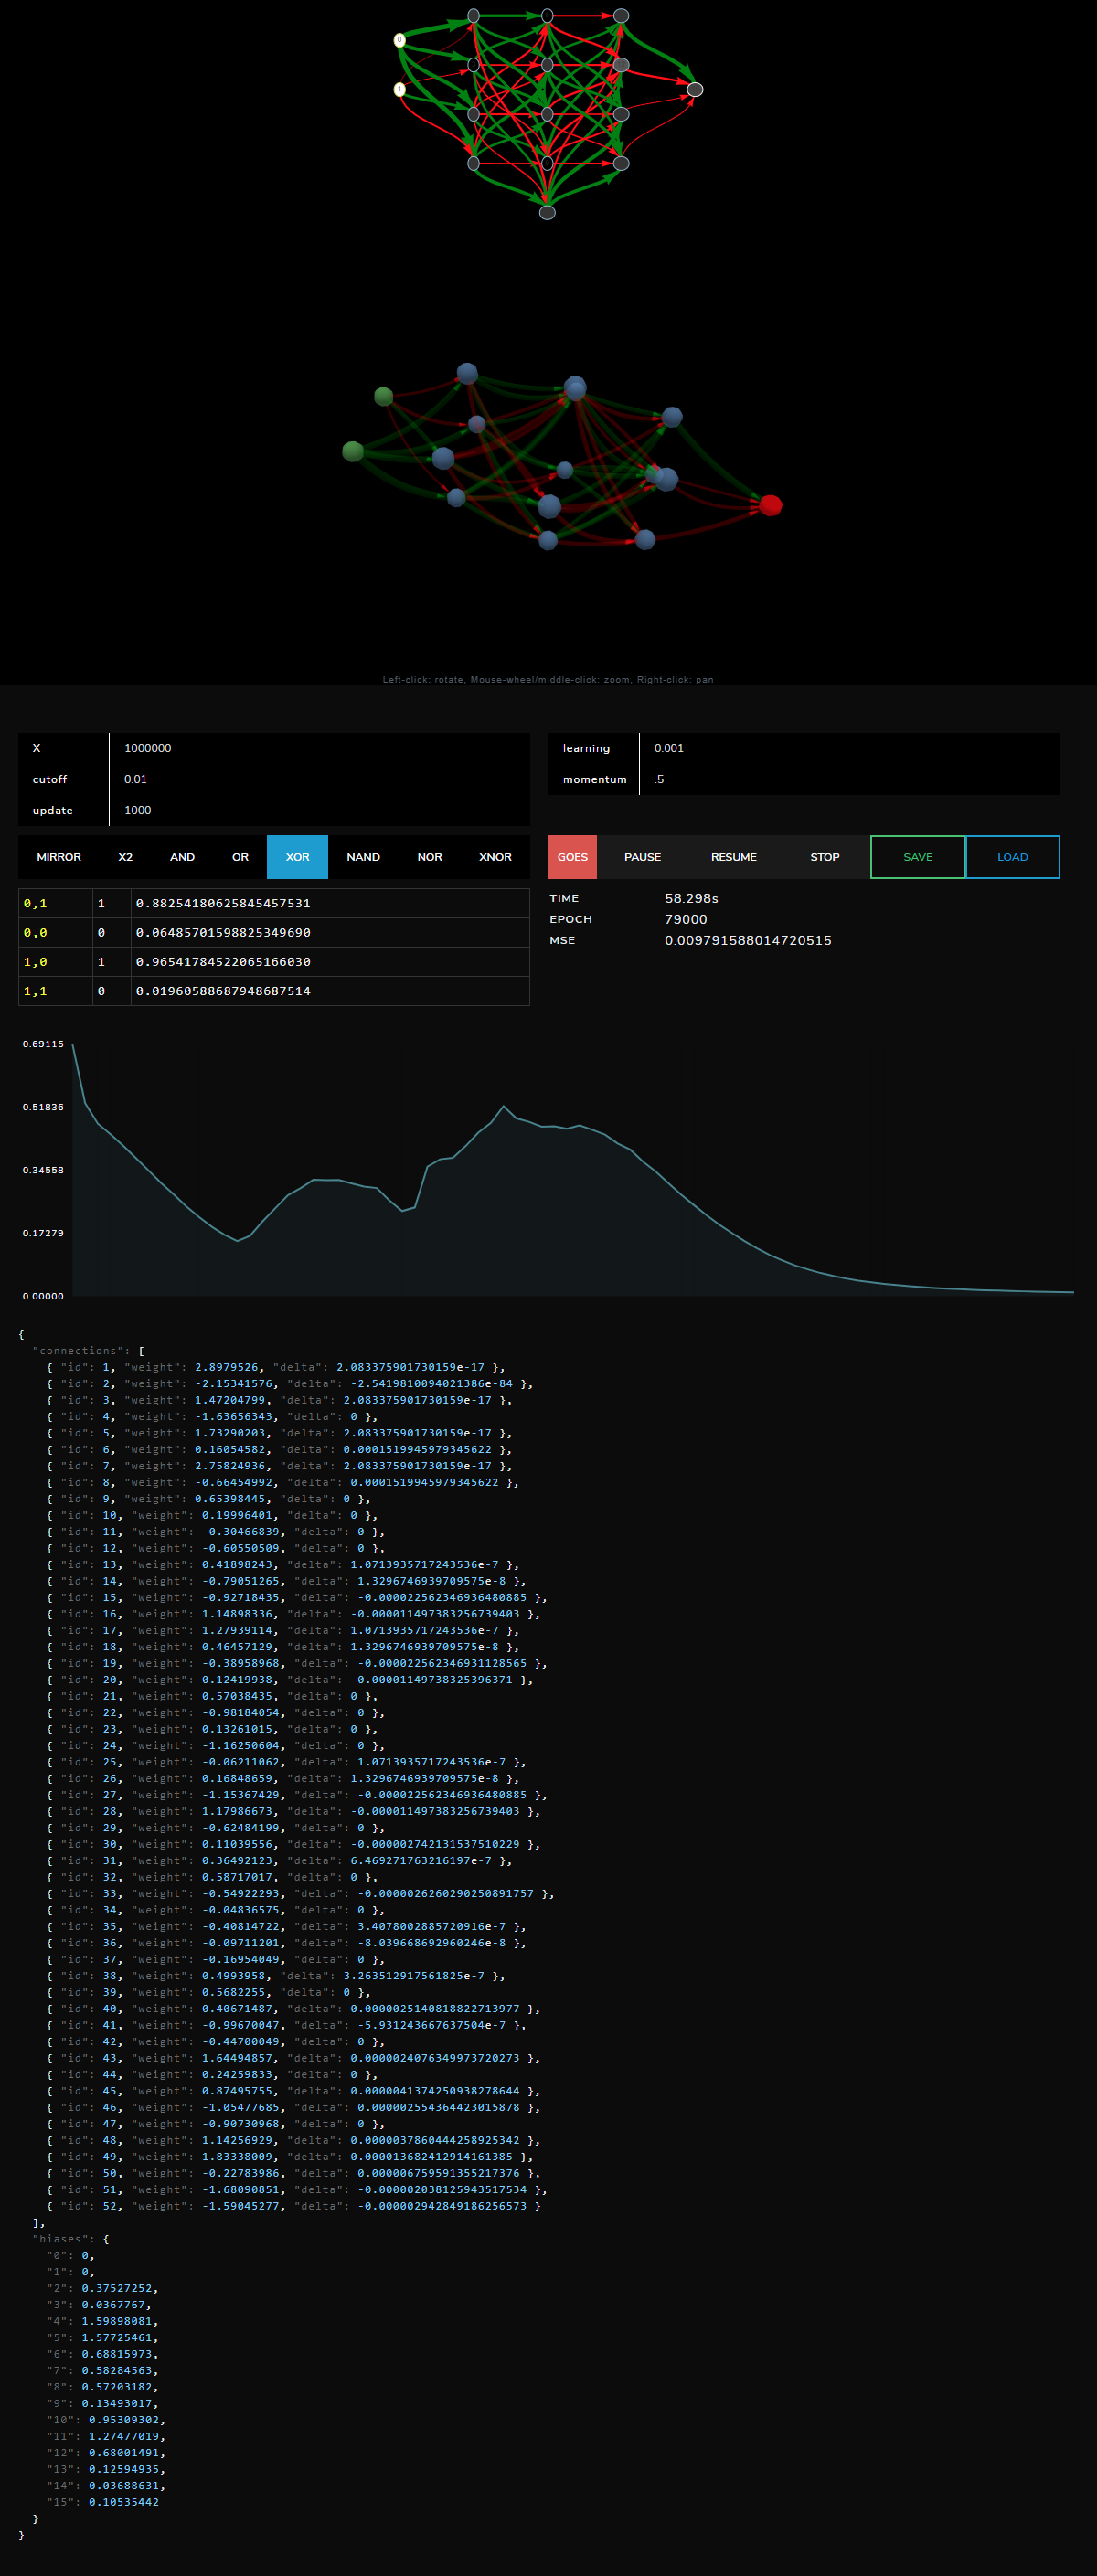
A visualizer for JavaScript neural networks, deep learning and machine learning models
This project is in its very earliest stages. Your contributions are very welcome especially in guiding the direction of the project!
To build a community welcome to all, NN-Viz follows the Contributor Covenant Code of Conduct.
And finally, a big thank you to all of you for supporting!
nn-viz is a Vue.js project that displays the structure of a network. The actual network is being trained in a seperate thread in a web worker.
For examples on how to create such a worker and how to communicate with the visualization thread, see src/workers.
For configuration options to pass to the worker, see the config object in App.vue (This is subject to change. We will most likely move this object to a stand-alone .json or even .js file)
To create a new worker, just add an entry here. A new button will appear in the control section of the visualizer. If you click it, the new worker will be set as active and commands will be sent to this particular web worker.
The web worker itself needs to have the same name and be created inside the src/workers directory.
The AND worker already exists as an example for this project but we will use it as an example on how to add a new worker and as part of the API examples regardless.
AND: { archtitecture: [2, 5, 5, 1] }
// This will create a new button "AND"
This event is fired when the worker has been selected, it might look like this:
{ event: 'initialize', config: { archtitecture: [2, 5, 5, 1] } }
This event is fired by the 'GOES' button in the control section. It commands the worker to start training the network. Arguments are the config options you set via the control section.
It might look like this:
{ event: 'goes', goestimes: 100000, cutoff: 0.001, updateInterval: 1000, learningRate: 0.01 }
The pause event commands the worker to pause its training. This pause is started once the current training interval has ended (see updateInterval goes config). No config other than the name of the event is passed.
The resume event commands the worker to continue the training. No config other than the name of the event is passed.
This commands the worker to load a certain network. The network is a JSON formatted export. To load it, use Network.fromJSON. The network sent to be loaded is the one last saved from the control section.
The web worker updates the visualization via events. The update event takes the following arguments:
network: the JSON formatted network exportepoch: the currently completed training epochresults: the actual activation values of the network compared to the input and ideal outputscore: the score/error of the network. For simplicity, the property is just calledscore
To export the network to JSON, simply call network.toJSON. To show activation values as part of the visualization, you need to manually add those.
The epoch is the counter of how many times an example has been run past the network. Simply pass an integer.
Results can be easily obtained via utils.evaluate. This will calculate the mean squared error and the results and deliver them as part of the evaluation with the keyword results
Score can be easily obtained via utils.evaluate. This will calculate the mean squared error and the results and deliver the score as part of the evaluation with the keyword score
Example:
const evaluation = utils.evaluate(this.network, examples);
self.postMessage({
  event: 'update',
  epoch: i,
  network: network.toJSON(),
  results: evaluation.results,
  score: evaluation.score
})
We encourage anyone who wants to debug any JS machine library to give it a try and give feedback. We have plans to continue developing it and extending its features, some of our planned updates:
- A way to single step through the network (activation by activation)
- Providing stand alone visualization components for use in other projects
- A clearer definition of the format the visualizers take to make it easier to plug in networks of different libraries
- More options for visualizers
- Visualization of lineage in the evolutionary modes of carrot