Home
Welcome to the Senseye wiki!

Senseye is a suite of tools for for monitoring, analyzing and visualizing everything from static files and crash dumps to live data flows and application dynamic memory.
Background-wise, it is losely mentioned in a rather confusing article I wrote a few years back as part of some thesis work ( search around for Retooling and Securing Systemic Debugging and Monitoring Infrastructure Affordances) and later influenced on ideas presented in Voyage of the reverser by Sergey Bratus and Greg Conti, and on Christopher Domas work on Cantor Dust which also takes inspiration from Aldo Cortesis visualization works.
Building / Testing / Running right now is unfortunately an exercise in frustration as you need the right combination of an install of the Arcan display server that is used for rendering an IPC and the set of senseye scripts and tools themselves. The reason for that is that the codebase is currently being refactored and rewritten to fix many of the usability issues that exist in the UI.
Links / Shortcuts:
See a Demo Video on youtube.
Get an Overview of components (moving parts).
Browse through a list of Features with links to details on how they work, planned changes and suggestions to what they can be used for.
Roadmap of upcoming releases and ideas for the future (may or may not happen).
Changelog of what features that are completed for the next version and what has happened in previous ones
Follow the link coupled with each feature entry to get a more detailed description about each feature and its current status.
Sensors: Sensors or senses provides samples of raw data that act as input to other analysis steps. They cover basic control e.g. regulating how large a window should be sampled, periodical refreshing, searching/stepping and so on.
Visual/Statistical Tools: These tools are accessible as part of the main UI, and typically involve the GPU in one way or another. The primary goal / use is to help you visually / statistically filter, select and extract data from samples acquired from connected senses.
- Distance Trackers
- Pattern Matching/Searching
- Histogram
- Entropy / Alpha Metadata
- Raw- Image decoding
- Byte-sequence highlighting
- 3D Views
- Mapping Modes
- Custom Colorization
Higher Level Translators: These are similar to sensors in the sense that you manually and explicitly chose which ones you want to connect and use. The difference come in that translators try to generate higher- level representations of sampled data.
The following figure shows how the different parts interact and what part is responsible for which feature.

Little should come as a surprise here, each sensor works as its own separate process with 1:1 relationship between data source and sensor. It connects to the senseye UI through the arcan shared memory interface that uses a domain socket for handle passing and initial connection negotiation, and a shared memory segment for everything else. Arcan, in turn, provides the audio/video/input abstractions and system integration along with the Lua scripting interface and support scripts for mouse gestures, primitive UI components and window management. Translators are used to provide information domain specific interpretation and higher-level representation (decoded images, audio playback, disassembly, ascii, ...). Lastly, the Senseye application itself ties it all together.
These are some quick pictures that illustrate some of the currently available sensors, presented mostly to taunt those that fail to download/build/compile/run senseye by themselves.

The image above shows the file sensor looking at the included testing binary (tests/test.bin). The distinguishing feature is the seekable control window (in noisy green on the left hand side) that also shows a preview of the file and a white tinted box estimating current offset and relative size. The data-window has its data mapped to a hilbert curve, and the red colored regions have higher entropy than the green ones. The little text counter below is an estimate of the base file offset of the visible region. To the right of the control region is a (normalized) histogram showing how often each distinct 8-bit value is presented (from 0 leftmost to 255 rightmost) in the input data. Below the data window is a point cloud representation of each data triple (first byte X, second byte Y, third byte Z) that here has the rather distinct pattern of an uncompressed image.
This picture shows the same general setup but with a different coloring shader in the data window that highlights the last clicked histogram bin (so we can see where in the data block a specific value is occuring) and the distinct pattern in the point cloud hints that we are dealing with some ASCII text.

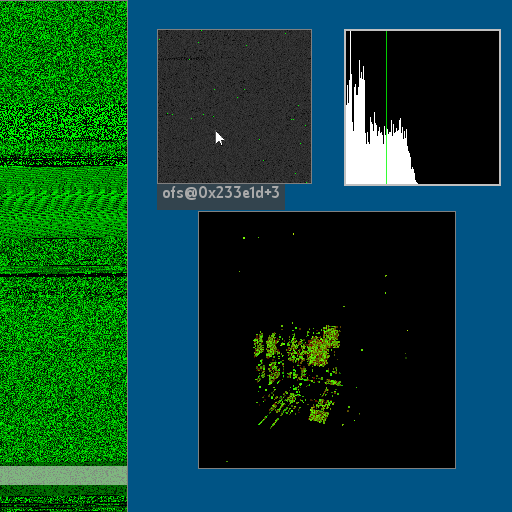
The image above shows a different sensor, mem that looks at live memory regions from running processes. The control window lists the currently mapped pages (with mapped files excluded), color coded by the current access mode. The green box indicates the currently selected page, and if you press enter a new data window will appear with the contents at the base of this page. The greyscale window to the right is a sparesly packed (only luminance preserved in the color channels), hilbert curve mapped magnified subset of a page (click- drag/release in a data window allows you to zoom subareas). The colored window to the right is a tightly packed (only alpha channel is used to convey metadata), wrap around mapped view of another page.

The image above shows the pipe (sensor exploring /dev/sda1 on some computer where we have encountered an interesting looking, yet unclassified, structure. The red/yellow color coded data only indicates entropy and the small green control window indicates that the pipe is still alive (turns red at EOF).

In the image above, things get more busy. Here we have activated translators for ASCII and Disassembly (that uses two instances of capstone, one for x86-64 and one for arm-v8), these are dynamically updated whenever the data window is updated from navigation, or when a specific position is set as base offset (shift+left click).
This section provides a rough outline of what features are planned for which upcoming release.
-
UI overhaul, reduce the amount of keybindings and obscure menus. Provide a decent automatic layout instead of being forced to drag/resize around so often.
-
Search reference image saving/loading between projects
-
Integrators, sensors and translators in one for both providing overlay information like symbol- type/name/width, data control (breakpoints,) etc.
-
add fault- injector support to all senses, with support for injection pattern control
-
xlt_disassembly improvements - integrate unicorn for setting regs and stepping through assembly on code slices, instruction reference lookup and grouping.
-
PE translator
-
xlt_audio for compressed and uncompressed audio visualization and playback.
-
execution tracing (3d graphs etc.)
-
ELF translator
Other ideas on the backburner that may/may not happen:
-
Parasitic version of memory sensor. Using proc/maps is a rather dull way of grabbing process memory and there is a whole lot of tricks that could be explored on less cooperative programs.
-
Event-triggered version of memory sensor that reacts on specific transformations on known pages (i.e. RX -> W -> RX) or (mmap(+X)) or (mprotect +X)), or highlights new-pages that exceeds certain dimensions (> 4k or similar) and samples on munmap.
-
Shader Construction UI - Currently, there are sets of predefined static shaders for the data window, the histogram and the point cloud. These should really be user-definable at runtime with caching common configuations, allowing the user to specify a combination of displacement (vertex stage), coloring (fragment stage), and highlighting (fragement stage).
-
Sound support - The streaming audio data channel is in place and working, but currently there is nothing mapped (and the softsynth properties of arcan need improvement) in terms of finding aural representations for some data.
-
Pretty Version - Arcan has native X-less support on the raspberry pi platform and several others, hacking together a non-interactive version of senseye with more focus on visual effects (bloom, trails, blending, shifting palettes, coordinate system transforms etc.) could make psense + netcat to show that information, indeed, is beautiful (and would be cool as a digital photo-frame kind of thing in place of the wallpaper displays that sci-fi promised us ..)
0.3:
- Overlays - It is now possible for a translator to provide a secondary windows that can be toggled and drawn as a translucent layer on top of the data window, adding coloring and meta information.
- New sensor feature, distance metadata - For sensors that use the rwstat interface, the alpha (metadata) channel can now be set to indicate which values that have changed from the last update.
- Sensor improvements, Msense - OSX memory support and filtering possibly uninteresting (zero- filled) or unreadable (dropped since scan) pages.
- New translator, xlt_img - Interface for hooking up image decoders for fuzzing and for decoding encoded images. Default uses STB_image.
- UI improvements - Reconnect translator windows if the translator dropped, drag-zoom
- Sensor improvements, Mfile - Can now lock- and step individual tiles, There is a 3D comparison feature that shows matching or mismatching bytes for each tile. It is also possible to crete meta-tiles that are a function of various binary operators with other tiles as operands.
- Sensor improvements, File - Preview window can now be set to highlight rows with sharp deviations in statistical distribution (easier edge- detection between different types in input file).
0.2:
- Translators - It is now possible to connect high-level decoders that track selected cursor position in data window to give more abstract views e.g. Hex, ASCII, Disassembly (using Capstone)
- New sensor, MFile – This sensor takes multiple input files of (preferably) the same format and shows them side by side in a tile- style layout, along with a support window that highlights
- New measuring tool, Byte Distance – This view looks a lot like the normal histogram, but each bin shows the number of bytes that pass from a set marker position, to the next time each possible value was found.
- New visual tool, Picture Tuner – This tool is used for manually and/or automatically finding raw image parameters (stride, color format and so on)
- New navigation control, Pattern Matching - Pattern finding using a visual pattern reference (like n-gram based mapping) and/or histograms matching.
- Improved seeking / playback control - multiple stepping sizes to chose from, along with the option to align to a specific value.
- Improved sensor, File: Now updates preview window progressively, and works a lot better with larger (multiple gigabytes) input sources.