This is a very light proxy for graphite metrics with additional features:
- Taking metrics from network (see configuration) or from file directly
- Buffering metrics if Graphite itself is down
- Function of summing/averaging metrics with a special prefix (see configuration)
- Filtering 'bad' metrics, which are not passing check against regexp
- Periodical sending to Graphite server to avoid traffic pikes
This is a representation of the Grafsy as a Black box
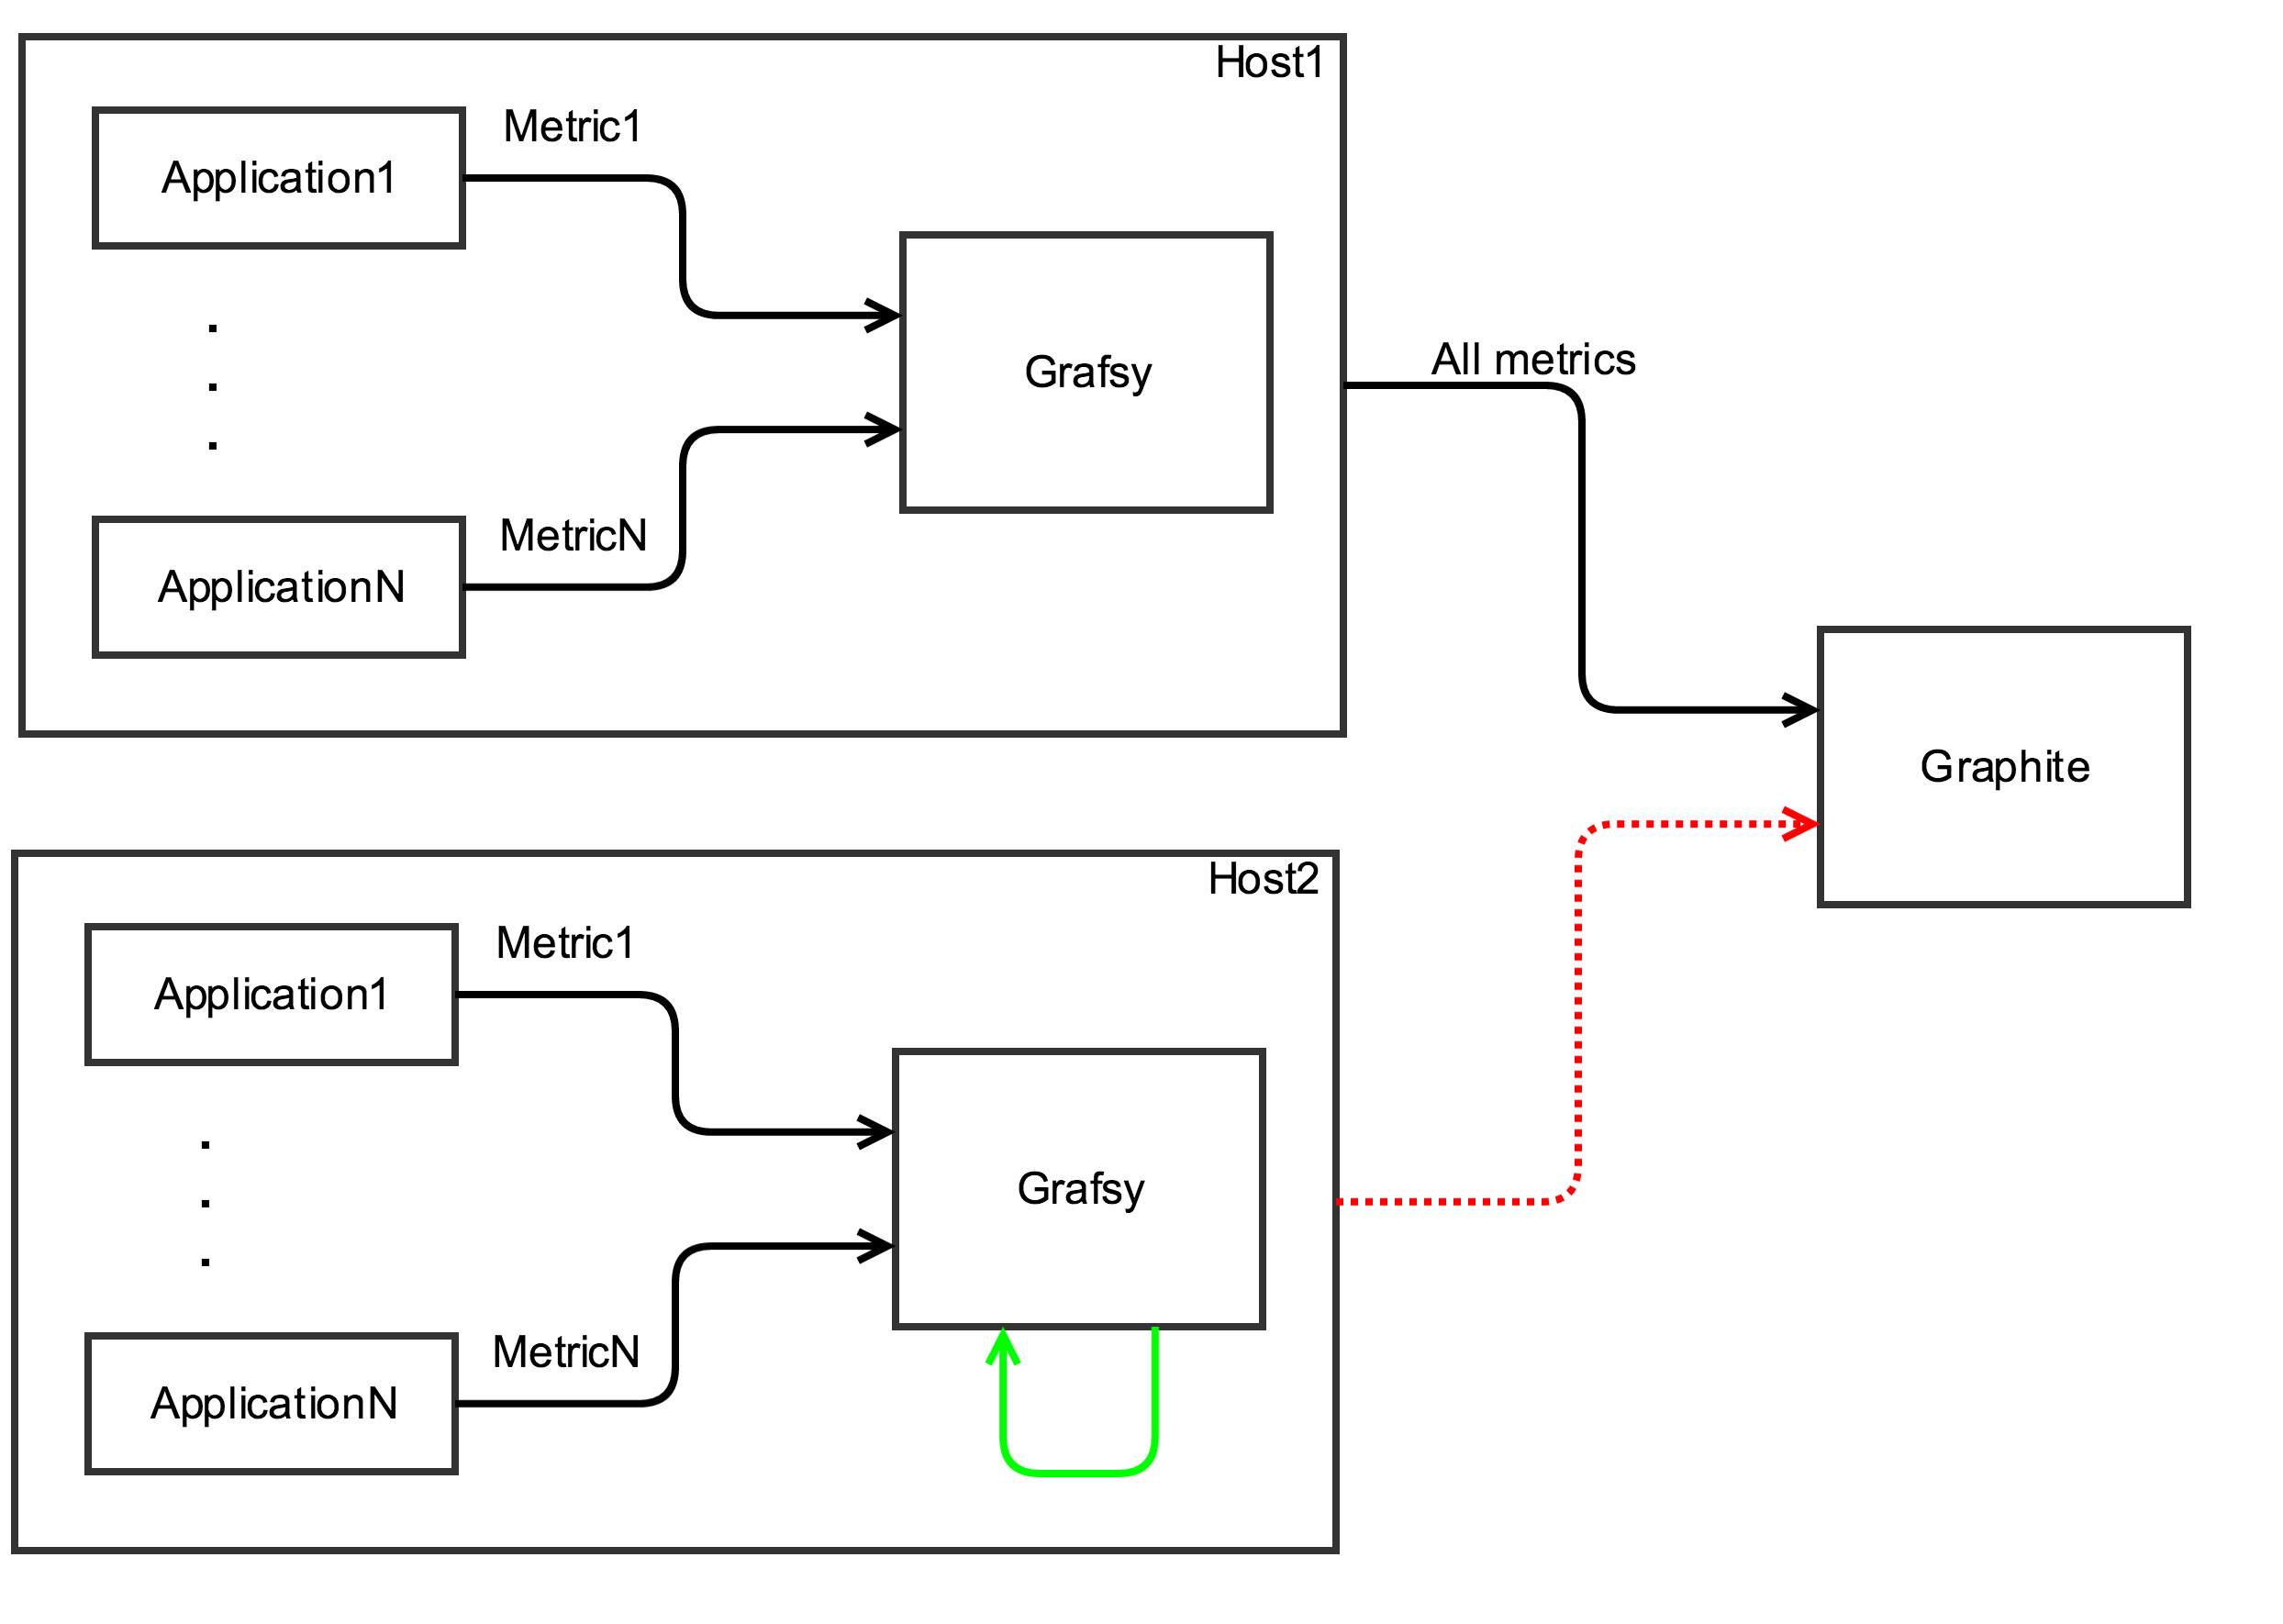
As you can see on diagram host2 lost connection to Graphite. With Grafsy it is completely safe, because it will retry to deliver metrics over and over until it succeed or limits will be reached
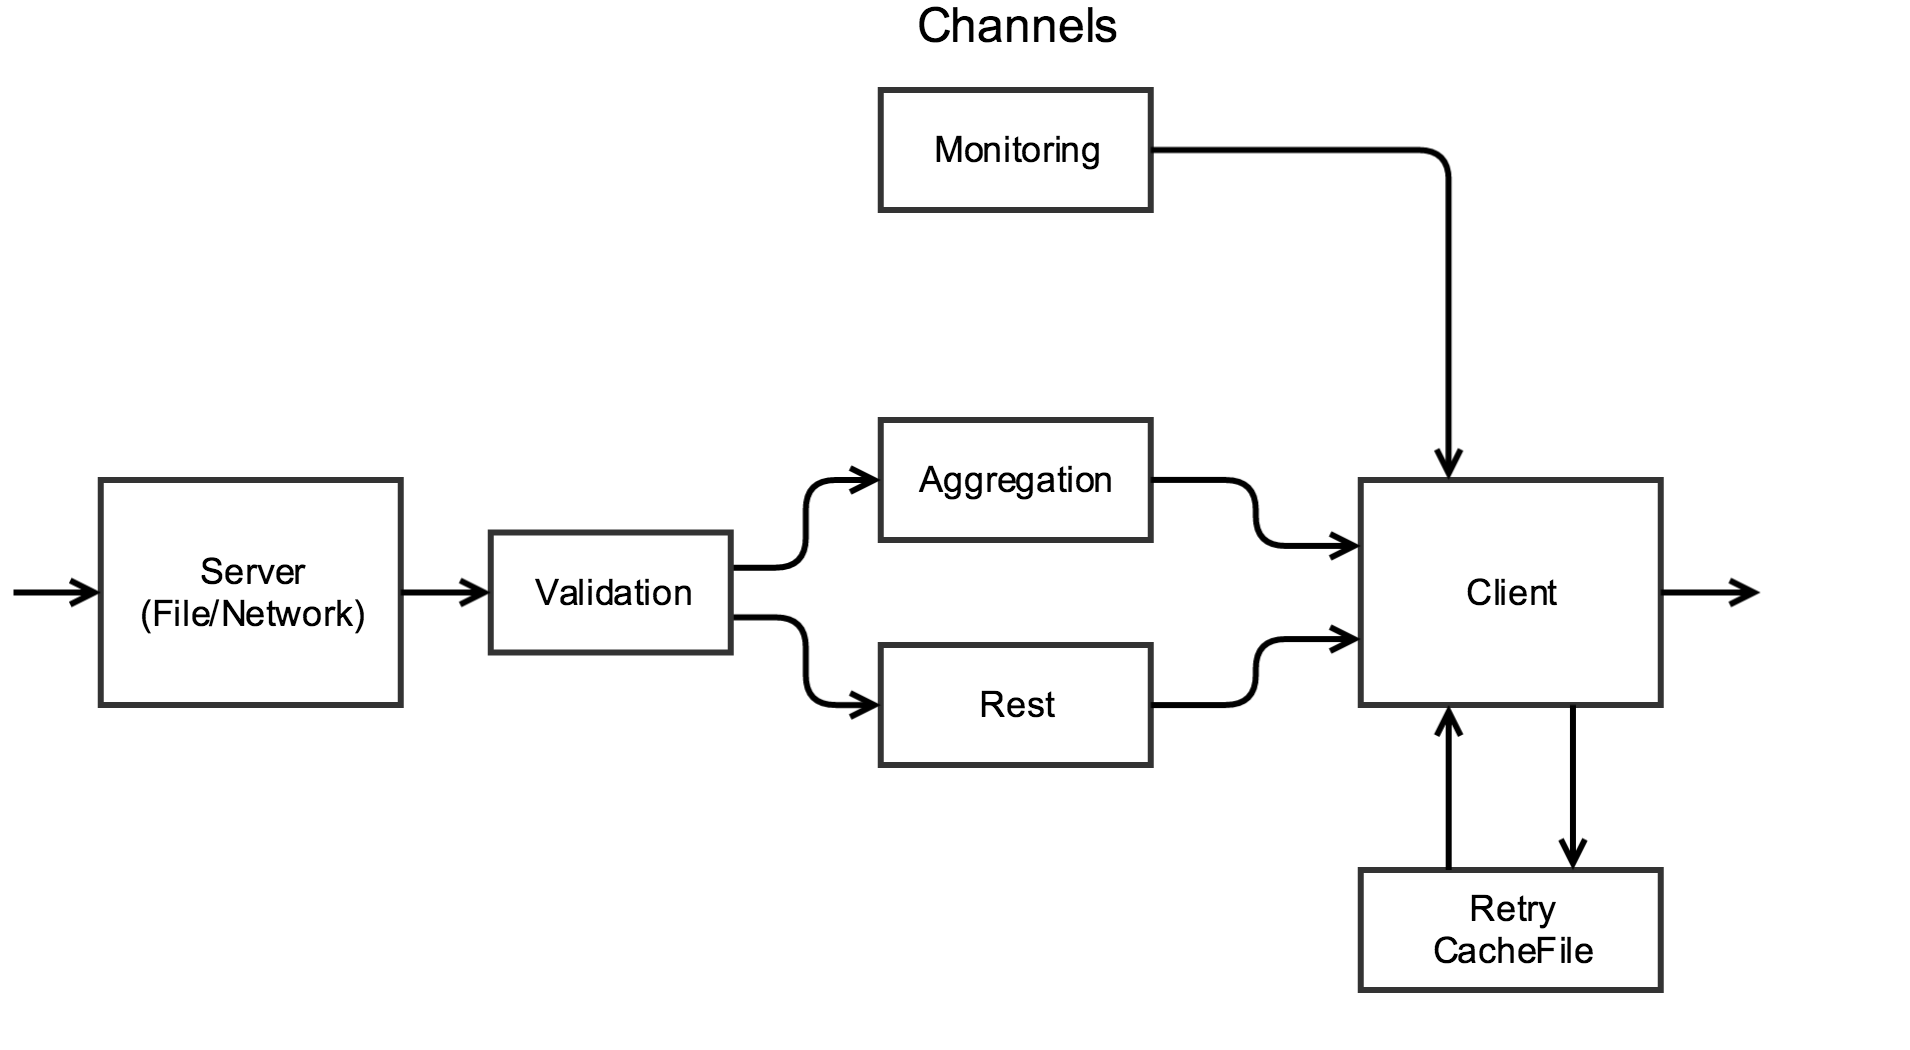
This is a simplified representation of internal components
Also I recommend you to see the presentation https://prezi.com/giwit3kyy0vu/grafsy/
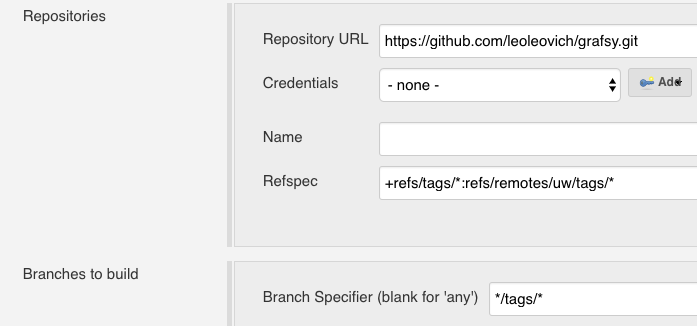
We are using release-based workflow with tags. Please do not add in your CI master branch. Use latest tag. For jenkins it might look like this (+refs/tags/*:refs/remotes/uw/tags/* and */tags/*):
Please look at releases
There is a config file which must be located under /etc/grafsy/grafsy.toml
But you can redefine it with option -c
Most of the time you need to use default (recommended) configuration of grafsy, but you can always modify params:
supervisor- supervisor manager which is used to run Grafsy. e.g. systemd or supervisord. Default is noneclientSendInterval- the interval, after which client will send data to graphite. In secondsmetricsPerSecond- maximum amount of metrics which can be processed per second
In case of problems with connection/amount of metrics, this configuration will save up toMetricsPerSecond*RetryKeepSecsmetrics in retryDir
Also these 2 params are exactly allocating memoryretryKeepSecs- how many seconds should be kept in retry files, at leastallowedMetrics- regexp of allowed metric. Every metric which is not passing check against regexp will be removedlog- main log file,-is treated as STDOUThostname- alias to use instead of os.Hostname() result
carbonAddrs- array of carbon metrics receivers.connectTimeout- timeout for connecting tocarbonAddrs. Timeout for writing metrics themselves will beclientSendInterval-connectTimeout-1. Default 7. In secondslocalBind- local address:port for local daemonmetricDir- directory, in which developers or admins can write any file with metricsuseACL- enables ACL for metricDir to let grafsy read files there with any permissions. Default is falseretryDir- data, which was not sent will be buffered in this directory per carbon server
sumPrefix- prefix for metric to sum. Do not forget to include it in allowedMetrics if you change itavgPrefix- prefix for metric to calculate average. Do not forget to include it in allowedMetrics if you change itminPrefix- prefix for metric to find minimal value. Do not forget to include it in allowedMetrics if you change itmaxPrefix- prefix for metric to find maximum value. Do not forget to include it in allowedMetrics if you change itaggrInterval- summing up interval for metrics with all prefixes. In secondsaggrPerSecond- amount of aggregations which grafsy performs per second. If grafsy receives more metrics thanaggrPerSecond * aggrInterval- rest will be dropped
monitoringPath- full path for metrics, send by grafsy itself. "HOSTNAME" will be replaced withos.Hostname()result from GO.
If os.Hostname() returns result with dots in it - they will be replaced with_.
You can define your own path. If it does not contain magic "HOSTNAME" word, it will be preserved.
At the end of your path grafsy will append grafsy.{sent,dropped,got...}
E.g servers.HOSTNAME.software or servers.my-awesome-hostname
Default is "HOSTNAME"
Grafsy can overwrite metric name. It might be very useful if you have a software, which has hardcoded path. E.g., PowerDNS 3. You can specify as many overwrites as you want. Each of them must be in separate section:
[[overwrite]]
replaceWhatRegexp = "^(SUM|AVG|MIN|MAX).pdns"
replaceWith = "servers.HOSTNAME.software.pdns"
[[overwrite]]
replaceWhatRegexp = "^pdns"
replaceWith = "servers.HOSTNAME.software.pdns"
This will ask Grafsy to replace all kinds of metric starting with pdns or aggregation prefixes ^(SUM|AVG|MIN|MAX).pdns to servers.HOSTNAME.software.pdns where HOSTNAME will be replaced with os.Hostname() output
The grafsy-client binary is implemented for easy metrics sending from generators to a grafsy daemon. You only need to specify the config file, if a not-default one is used.
It sends either metrics from specified files or from STDIN.
Usage: ./build/grafsy-client [args] [file1 [fileN...]]
   Or: metrics-generator | ./build/grafsy-client [args]
- Install go https://golang.org/doc/install
- Clone this project:
git clohe https://github.com/leoleovich/grafsy.git && cd grafsy - Compile project:
make - Copy a config file:
mkdir /etc/grafsy && cp grafsy.toml /etc/grafsy/ - Change your settings, e.g.
carbonAddrs - Run it
./build/grafsy - Send metrics via client
metrics-generator | ./build/grafsy-client
Image available as leoleovich/grafsy.
See entrypoint.sh for configuration details.
Binary RPM and DEB packages are available as release assets for tags > v2.0.