Capstone Project for Coursera Specialization: "Retrieving, Processing, and Visualizing Data with Python".
I downloaded data files from http://www.inegi.org.mx/, and I designed a variable called ProAmbiente (Pro-environment), based on each home's level of consumption of products that generate pollution and the frequency in which they invested on repairments instead of throwing them away. I wrote Python programs to read, extract, analyze and visualize that data, in a way that anyone can use them for their own purposes, by entering the name of their own files.
Visualizing data:
Gender of person who supports economically the house (sexo_jefe):
- Male
- Female

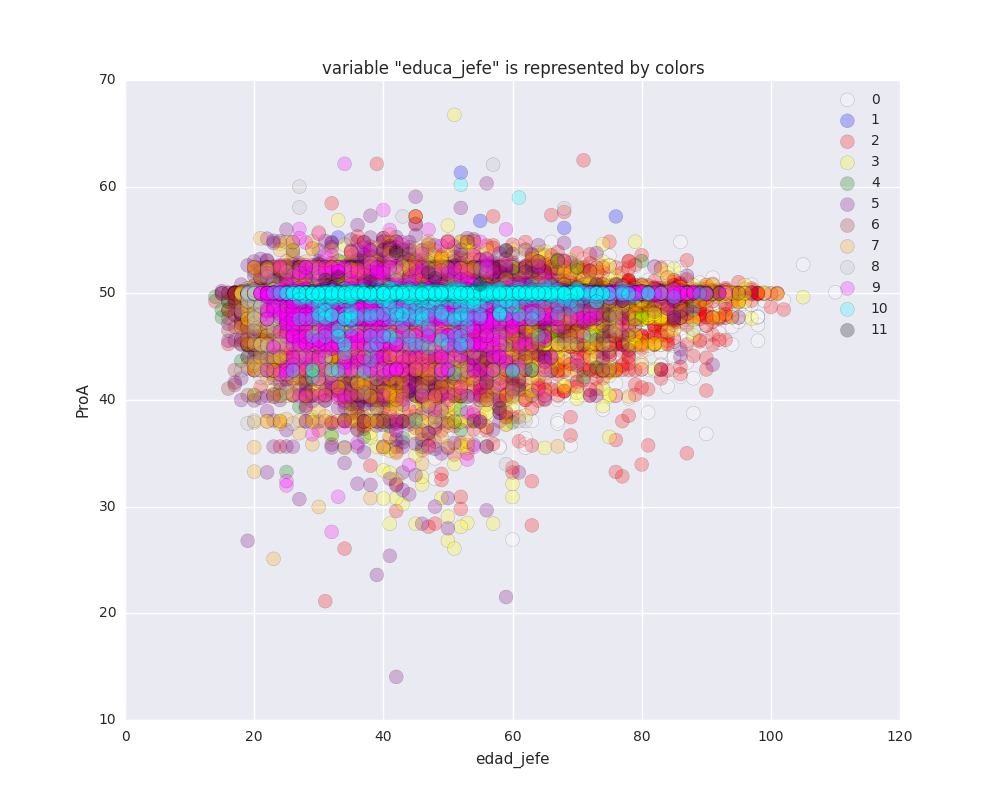
Education (educa_jefe): From zero to masters/graduate completed (0-11).
- Keys (originals): 0) Nada, 1) Kinder, 2) Primaria (trunca), 3) Primaria (terminada), 4) Secundaria (trunca), 5) Secundaria (terminada), 6) Preparatoria (trunca), 7) Preparatoria (terminada), 8) Carrera técnica (terminada), 9) Licenciatura (trunca), 10) Licenciatura (terminada), 11) Posgrado (terminado).
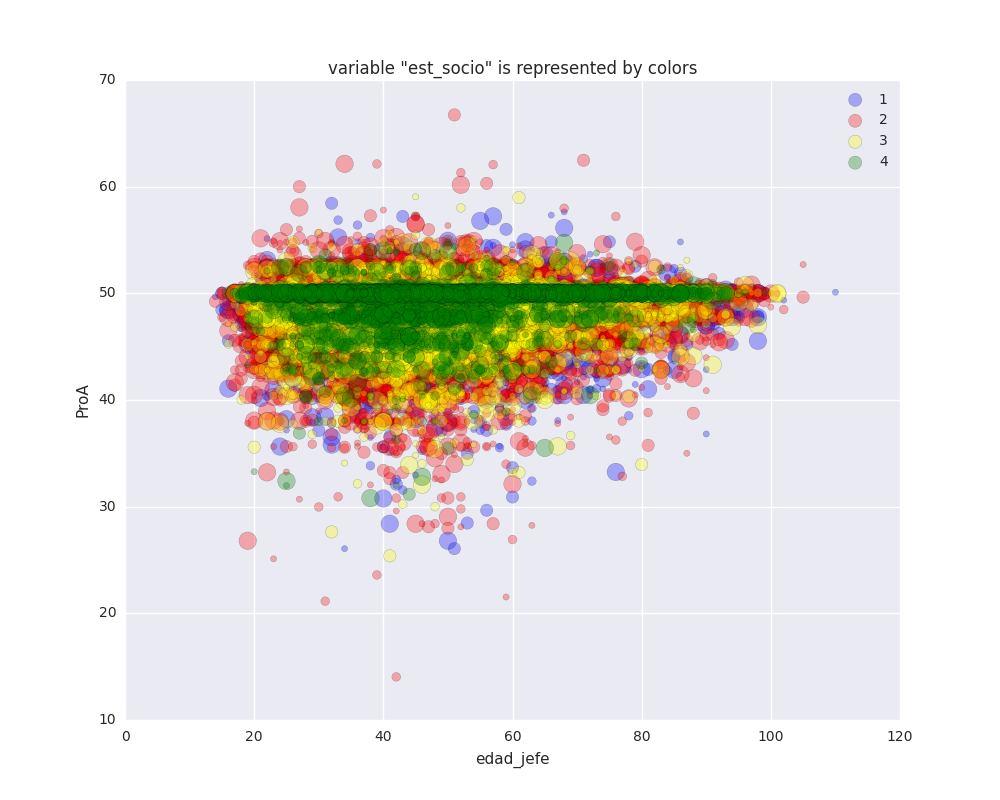
1. Baja (Low) 2. Media baja (Lower middle class) 3. Media alta (Upper middle class) 4. Alta (High)
* Other interesting results (total_int = members per home):


The main INSTRUCTIONS for the programs are very simple:
- The files must be in the same folder of the scripts.
- Select file.
- Select column header.
- Select alpha (if applies).
- Enter 'ya' to quit.
- etc.
All the programs have the same structure so you can use the same keywords to start/proceed/quit.
-
- Returns Measures of Central Tendency:
- N, mean, standard deviation, standard error, etc.
- Returns sampling distribution graph
- Returns z-value and p-value from z-table
- Returns z-score
- Calculates One tailed T-test
- Returns confidence interval
- Returns acceptance/rejection of the null hypothesis.


Quiet demo here.
-
- Calculates Two tailed T-test
- Returns column behavior graph
- Returns differences of means graph
- Calculates t-statistic
- Returns Cohen's D
- Returns acceptance/rejection of the null hypothesis
- Returns confidence interval


Quiet demo here.
-
- Value replacement (I used it to convert string characters into integer values)
- Example: I converted keys like "K023", which referred to buying solar panels or having an alternative electricity source ("Compra e instalación de paneles solares y planta de luz propia") into a value that contributes to the overall score variable I created.
- Note: You need to modify this code in order to convert your own data
- Value replacement (I used it to convert string characters into integer values)
-
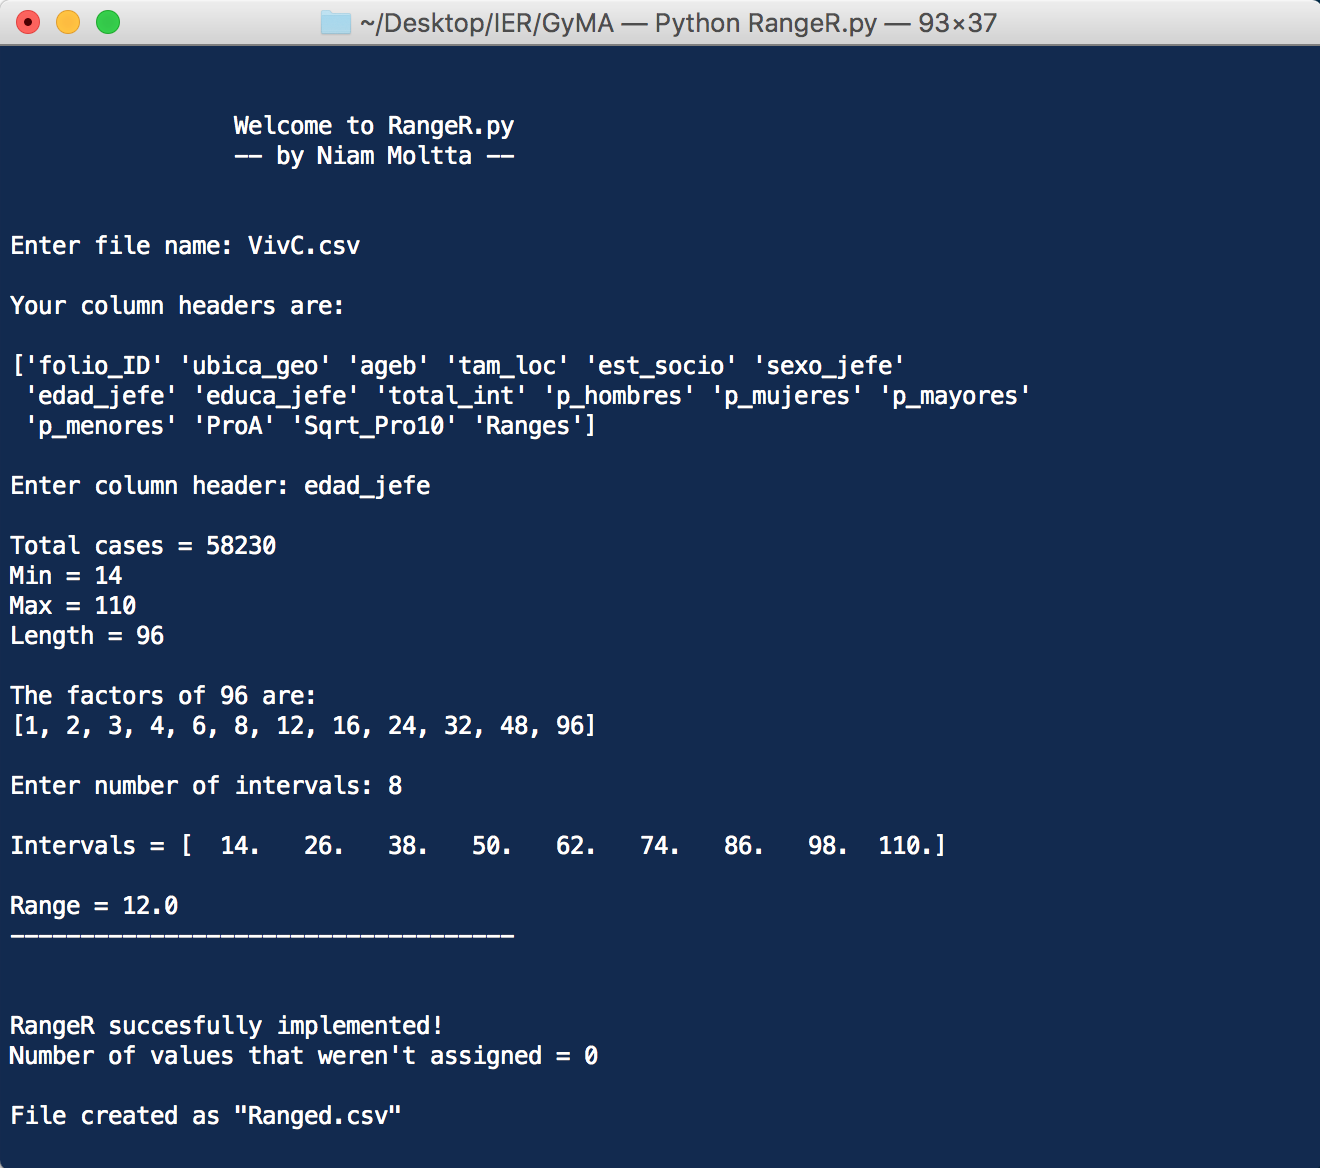
- Values assignment to Intervals
- Returns minimum and maximum
- Returns factors for that range
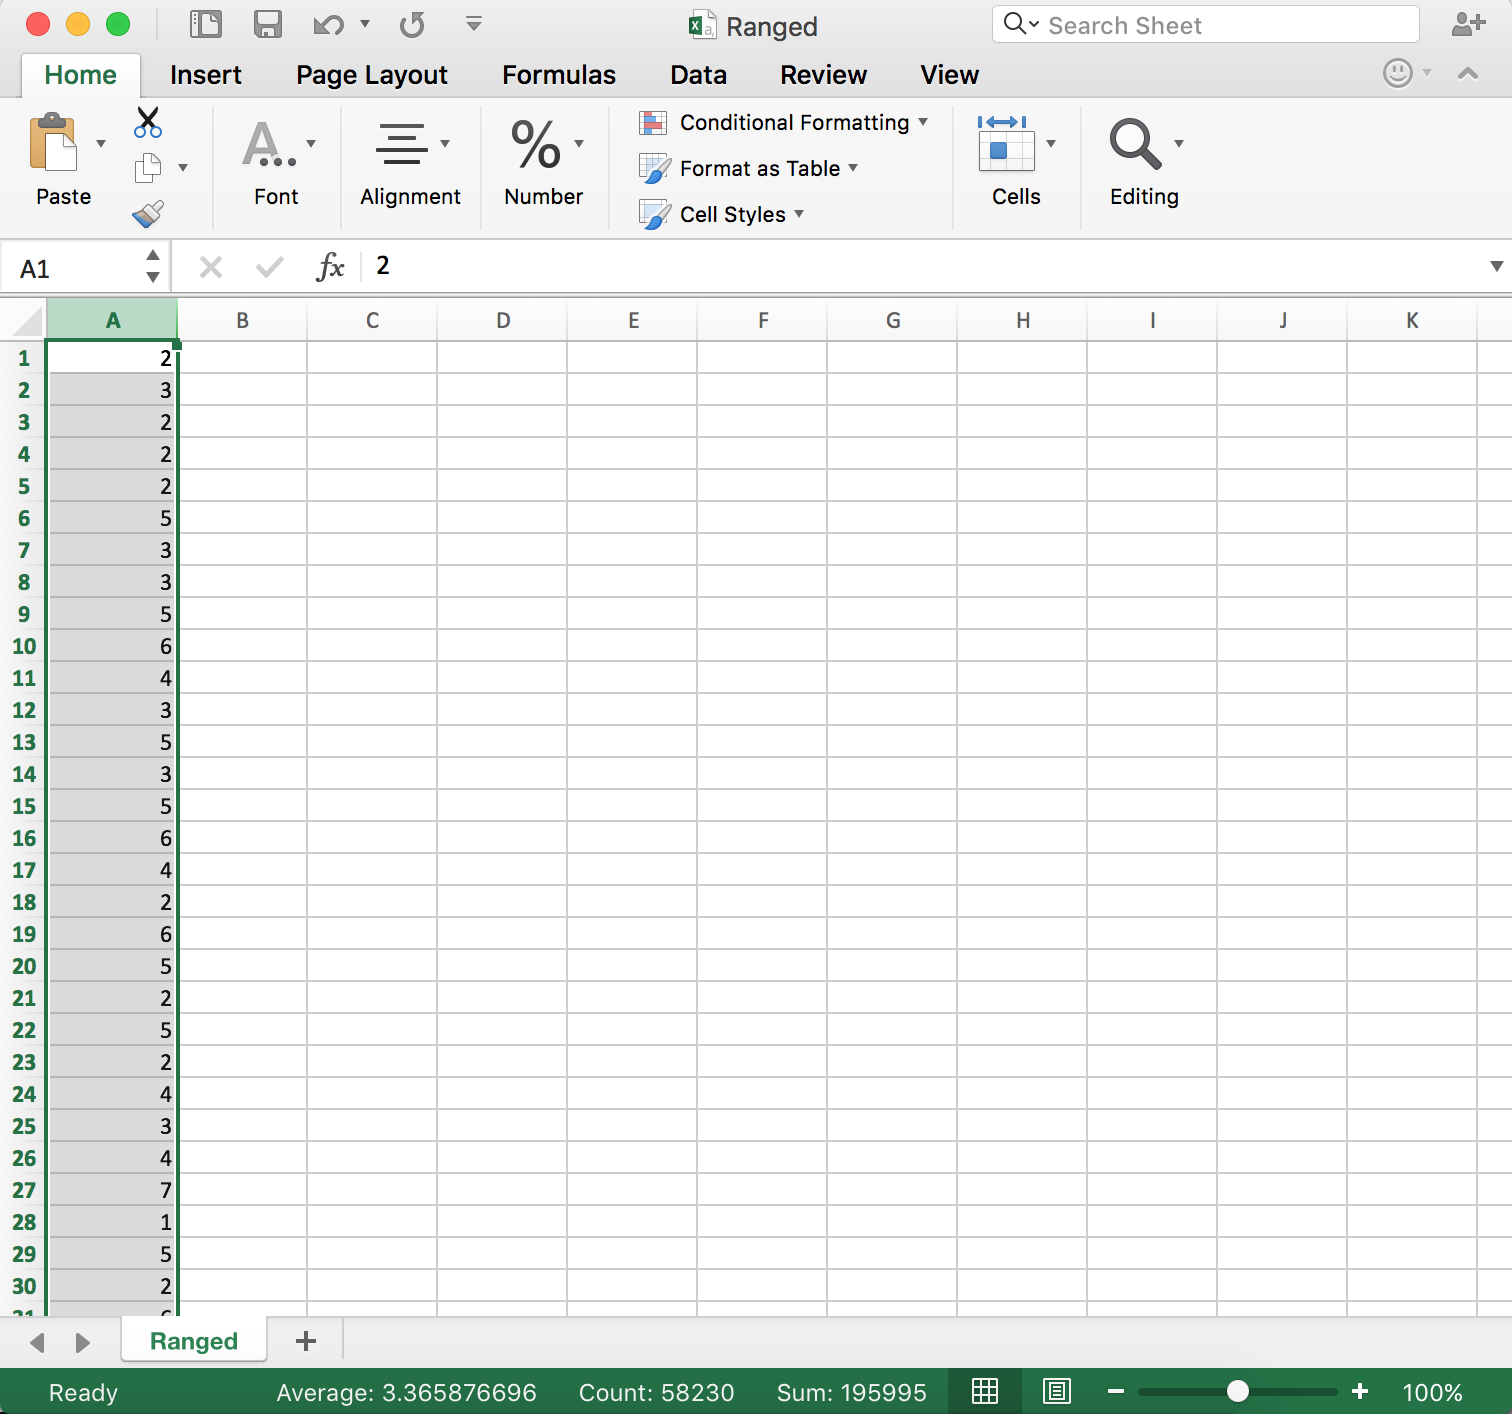
- Returns new file with data split by intervals
- Returns frequency and cumulative frecuency for values in those intervals.
-
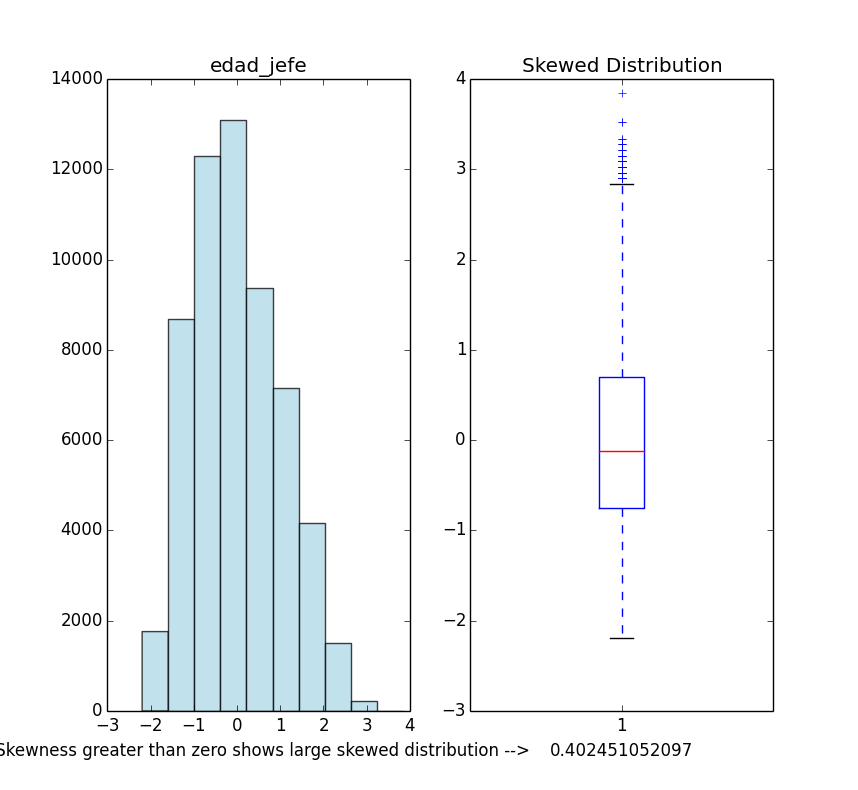
- Skewness calculation
- Returns skewness value and skewness graph

-
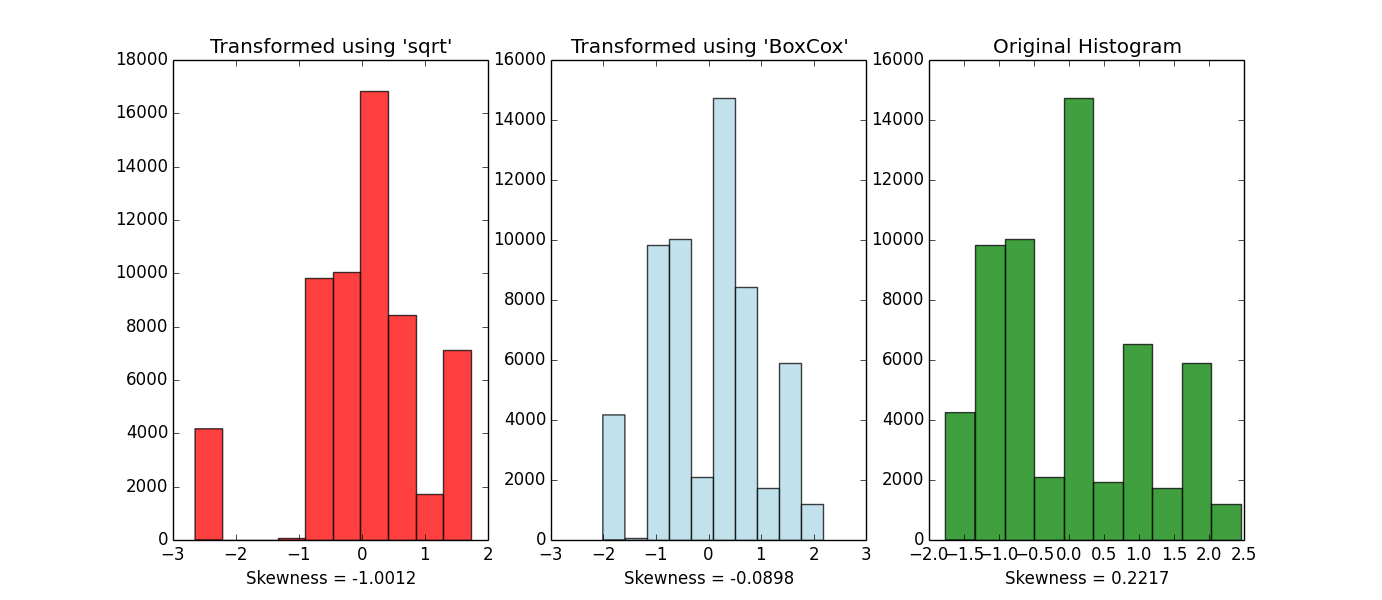
- BoxCox transformation to reduce skewness
- Returns a set of histograms to compare:
- Original data histogram
- Un-skewed data using 'sqrt' histogram
- Un-skewed data using 'BoxCox' histogram
- Returns file with new data (using BoxCox or sqrt, optional)
-
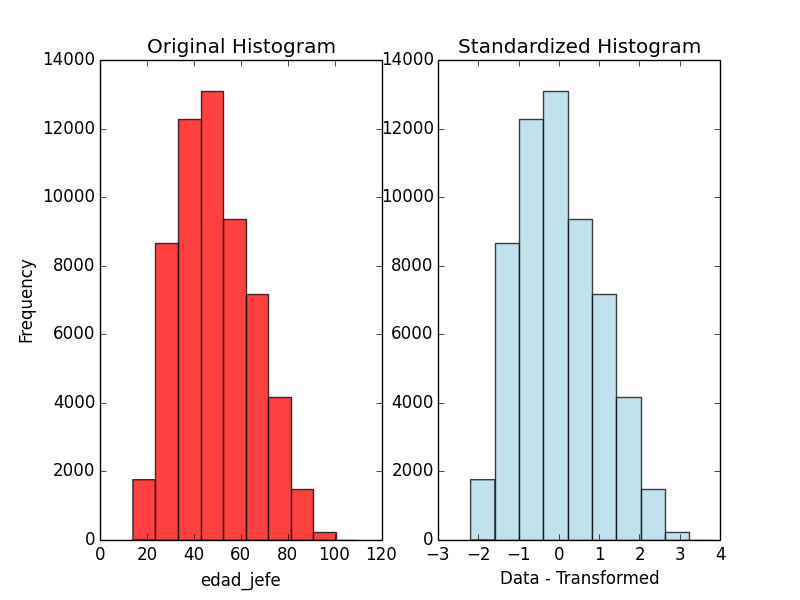
- Performs standardization of data
- Returns comparison graphs
- Returns new file with standardized data

-
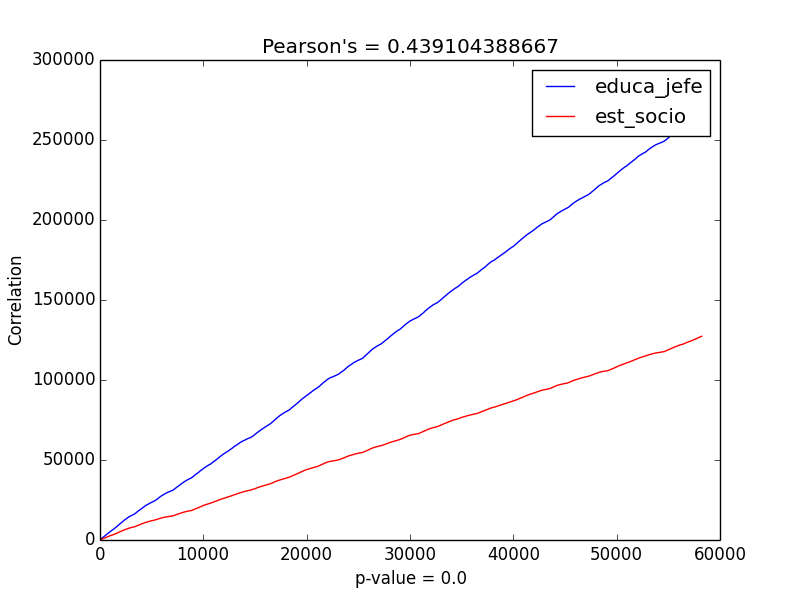
PeaR.py (New error dealing with zeros)
- Returns Pearson correlation coefficient
- Returns p-value
- Returns graph of correlation relationship

-
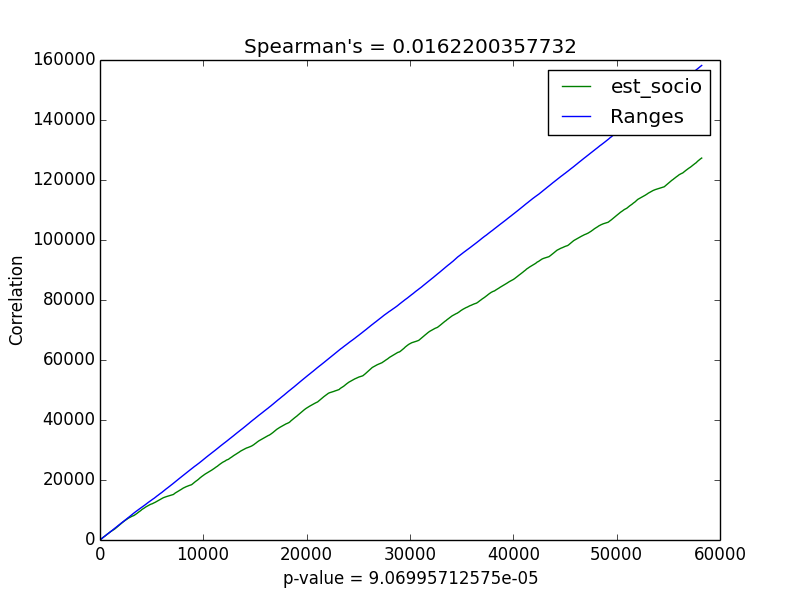
SpeaR.py (New error dealing with zeros)
- Returns Spearman correlation coefficient
- Returns p-value
- Returns graph of correlation relationship

- Anowoa.py (New pandas index error)
- Performs Analysis of Variance (ANOVA), one or two ways (optional)
- Returns Analysis of Variance between two or more group means
- Returns Degrees of Freedom, Sum of Squares, Mean Square
- Returns F-value and p-value
- Returns Eta squared and Omega squared for effect size
- Returns ANOVA table and variables scatter graph


More data visualization coming soon...
- Performs Analysis of Variance (ANOVA), one or two ways (optional)
How to Python:
Downloads here!- Macintosh.
- Unix.
- Windows:
~ Tutorial for Windows installation.
~ Easy Way to run Python Programs on Windows.
