Homepage: https://kwstat.github.io/gge
Repository: https://github.com/kwstat/gge
Functions for GGE (genotype plus genotype-by-environment) and GGB (genotype plus genotype-by-block-of-environments) biplots.
-
Stable, well-tested.
-
Many options to control graphic appearance.
# Install the released version from CRAN:
install.packages("gge")

# Install the development version from GitHub:
install.packages("devtools")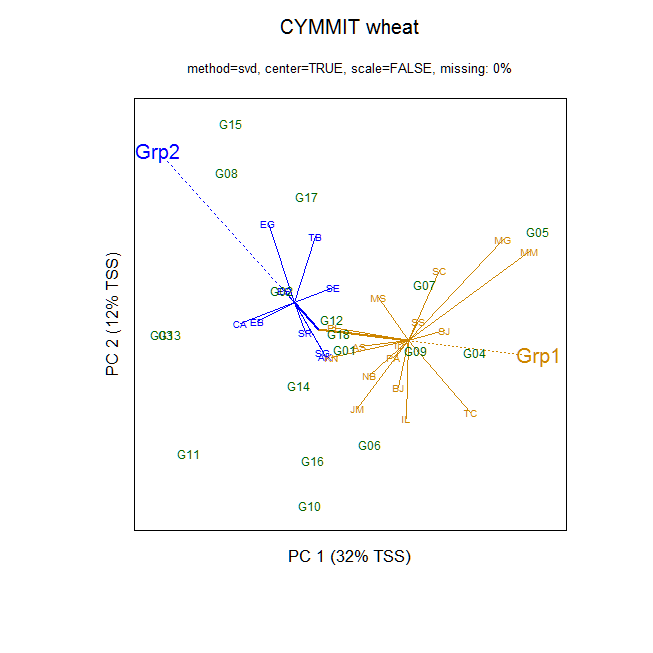
devtools::install_github("kwstat/gge")In the example GGE biplot below, the genotypes are shown by green labels and the environments are shown by blue/gold labels. Each color determines a mega-environment or block-of-environments. A thick, solid line is drawn from the origin to the 'average' of the environments within each block, and then a thinner line is drawn from the average to the individual environments. These 'residual' vectors show the deviations within each group. A dashed line extends to the edge of the plotting window and labels the group.