When connection or data read timed out the internal ribbon load balancer automatically retries. The number of host(s) to retry and number of attempts on each controlled by next two ribbon configurarion parameters:
.ribbon.MaxAutoRetries=x .ribbon.MaxAutoRetriesNextServer=y
Internally the total number of retries equals next formula: (MaxAutoRetries + 1) * (MaxAutoRetriesNextServer + 1)
For example next demo-producer configuration parameters means retry 5 times on same host and than try 2 more hosts with 5 retries on each. The total number of retries will be 6 * 3 = 18
data-consumer.ribbon.MaxAutoRetries=5 data-consumer.ribbon.MaxAutoRetriesNextServer=2
The data-consumer has pre-configured parameter emulating slow slow application response
The service response timeout is random in same [0,1] range
- Build all project
mvn clean install
- Start service registry
java -jar reg-service/target/reg-service-1.0.0-RELEASE.jar
- Start 3 data-consumers (all on different hosts)
java -jar data-consumer/target/data-consumer-1.0.0-RELEASE.jar --server.port=8081
java -jar data-consumer/target/data-consumer-1.0.0-RELEASE.jar --server.port=8082
java -jar data-consumer/target/data-consumer-1.0.0-RELEASE.jar --server.port=8083
There are multiple demo scenarios for with good/bad connectivities. Even if ribbon load balancer has a good retry ability (with same payload) it will not try forever and can potentially fail when exceed the confitured maximum number of retries (see info section)
The default configured read timeout for data-producer by default is set same value as delay for data-consumer. This means it should be 100% success rate on each request.
The demo steps are next:
- Start 3 data-providers with next configuration parameters
java -jar data-provider/target/data-provider-1.0.0-RELEASE.jar --demo.id=1
java -jar data-provider/target/data-provider-1.0.0-RELEASE.jar --demo.id=2
java -jar data-provider/target/data-provider-1.0.0-RELEASE.jar --demo.id=3
-
Wait until all completes (approx 8 min.)
-
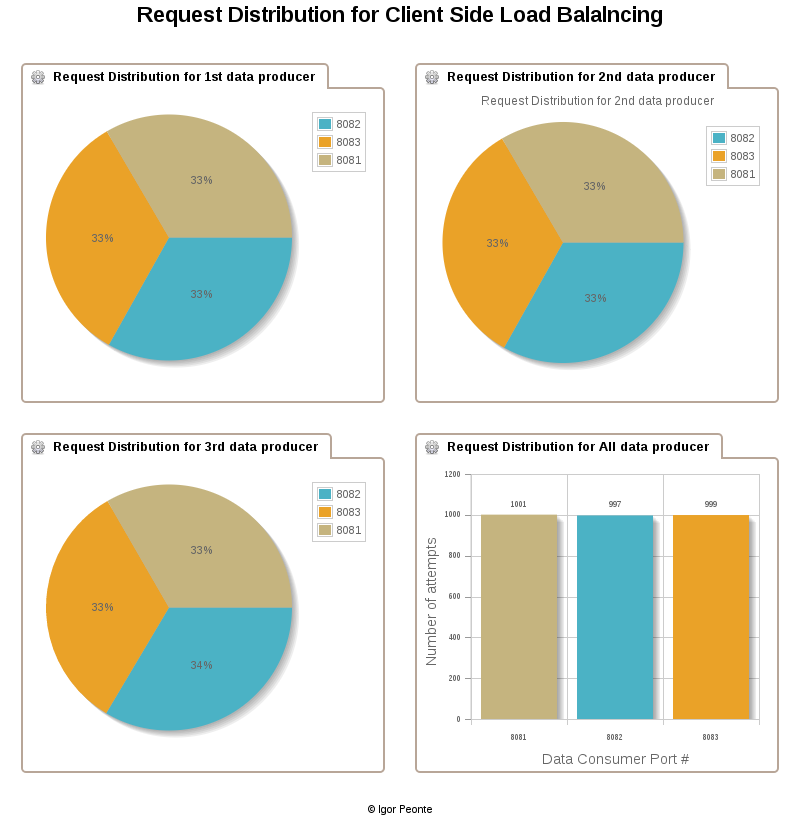
Check portsX.csv for automatic requests distribution between different data-consumers
Same configuration as for previous demo
The demo steps are next
- Start 3 data-providers with next configuration parameters
java -jar data-provider/target/data-provider-1.0.0-RELEASE.jar --demo.id=1
java -jar data-provider/target/data-provider-1.0.0-RELEASE.jar --demo.id=2
java -jar data-provider/target/data-provider-1.0.0-RELEASE.jar --demo.id=3
-
During test randomly stop/start 1 or 2 data consumers, for example 2.1. stop 1st consumer 2.2. stop 2nd consumer 2.3. wait 5 seconds 2.4. start 1st consumer 2.4. watch the logs and wait until each producer start altering between 1st and 3rd consumers i.e. rotate requests between 8081 and 8083 2.5. stop 3rd consumer 2.6. start 2nd consumer 2.7. Repeat step 2.4 but for 1st and 2nd consumers 2.8. start 3rd consumer. 2.9 wait some time and check that producers now distributing requests evenly between all consumers.
-
After all data-producers finished check each portX.csv. Should be no errors
grep ERROR ports?.csv
The scenario with rolling restart can be used for service upgrade with ZERO DOWNTIME
The configured connection and read timeout for data-producer is set 0.1 of maximum reading timeout and response timeout. So it gives 90% chance on failing for single time connection and for 5 retries on same server the chances it totally fail will be 0.9^18 = 0.150094635 ~ 15% For a 999 attempt the expected number of errors will be 149
Since we running 3 instances and restarting them time by time the chance the request fails will be much less but still quite possible.
- Start 3 data-providers with next configuration parameters
java -jar data-provider/target/data-provider-1.0.0-RELEASE.jar --demo.id=1 --demo.read_timeout=100
java -jar data-provider/target/data-provider-1.0.0-RELEASE.jar --demo.id=2 --demo.read_timeout=100
java -jar data-provider/target/data-provider-1.0.0-RELEASE.jar --demo.id=3 --demo.read_timeout=100
-
Wait for all producer to finish. The test will be going slower and takes longer time (~ 13 min) because of retries
-
Check portsX.csv for errors.
grep ERROR ports?.csv
If all setup were correct you should see approximately 149 errors on each data-producer.
Using OsBiTools data engine it is very easy visualize data from scenario #1. All corresponded files for data mapping and page design can be found in /doc/osbitoos sub-folder. Below is snapshot from page build with this amazing visualization engine.