This repository contains a collection of scripts for calculating all-sky average light pollution from satellite data and visualizing changes in night-time sky quality over time. It was created to understand the effects of nearby and faraway light sources on Big Bend National Park's sky quality, using open-source tools.

Night sky quality calculated biannually between 2012 to 2019 in the Big Bend region, visualized by sky-quality classes.
The main script in this repository, Clip_raster_and_calculate_ALR_Python.py, takes in a satellite image composite of average night-time radiance for a single month and outputs the all-sky average light pollution ratio (ALR), a metric that reflects the effects of artificial light on sky quality from up to 300 kilometers away. ALR can be used to quantify visual sky quality classes:
| Sky quality class | ALR |
|---|---|
| Good | 0 - 0.33 |
| Moderate (threatened) | 0.33 - 2.0 |
| Poor (for sensitive protected areas) | 2.0 - 10.0 |
| Milky Way invisible | > 10.0 |
By calculating ALR and the associated sky quality over the dates available from the VIIRS instrument, we can begin to quantify how night-sky quality is changing over time, and identify threat to our night skies from light pollution elsewhere.
Duriscoe et al. (2018) used the Suomi NPP satellite's Visible Infrared Imaging Radiometer Suite nighttime sensor (the Day/Night Band), which measures nighttime upward radiance, to calculate what they called the all-sky average light pollution ratio (ALR), a unitless ratio of anthropogenic to natural conditions that takes into account the effects of skyglow over the entire hemisphere of vision.
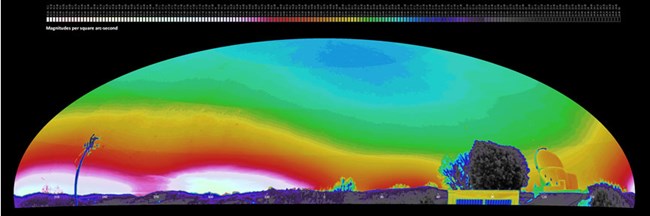
False color negative, panoramic image from Palomar Observatory (California Institute of Technology) identifies natural and human-caused sky brightness
NPS / Palomar Observatory (California Institute of Technology)
ALR at a point can be calculated by summing the contributions of individual upward radiance values, weighted by their distance from the point, up to a radius of 300 km away. i.e. ALR = c ∑ridi-α, where c is a calibration constant to compare the calculated output to observation data, α is a weighting function relating brightness to distance, di is the distance from the point, and ri is the upward radiance at the distance of interest.
Duriscoe et al. also derived a brightness/distance function using observational data from the western United States to relate brightness to distance from a source, with α = 2.3 ((d / 350)0.28)
Below is a schematic from Duriscoe et al. explaining this process.

This process can be optimized using open-source geospatial tools and image-processing techniques. To calculate ALR at a single point, we look at the contribution from N equally spaced annuli up to 300 km away. Along each annulus, the radius is constant and hence the distance weighting parameter, di-α, is also constant, so a single annulus's contribution to ALR is the sum of upward radiances around that annulus, multiplied by the value of di-α at that radius. This process is repeated across all N annuli, and at every point in the image.
Calculating the sum of upward radiance at a single annulus across the entire image simplifies to a convolution of the image, where the kernel is a matrix of 0s and 1s representing the annulus. For example, with a annulus radius of 2, our kernel looks like this:
| 0 | 0 | 1 | 0 | 0 |
|---|---|---|---|---|
| 0 | 1 | 0 | 1 | 0 |
| 1 | 0 | 0 | 0 | 1 |
| 0 | 1 | 0 | 1 | 0 |
| 0 | 0 | 1 | 0 | 0 |
The output convolution for each annulus is then normalized by the distance weighting parameter and then all normalized outputs are summed together to produce a complete ALR raster. Next, the raster is multiplied by the calibration constant C = 1/562.72, to relate model output to observational values of ALR. The convolution makes use of a Fast Fourier Transform, and the time to process a single VIIRS image for the Big Bend area (about 350,000 km), including opening the compressed image file and clipping, was about 10 minutes on a single machine.
For more information on how to calculate ALR for your own region, check out the how-to page.
See LICENSE.txt