Skip to content

katreparitosh/TABLEAU-EDA-Power-Supply-India

Folders and files

NameName
Last commit message
Last commit date

Latest commit


History

12 Commits


Repository files navigation

POWER SUPPLY AND DEMAND ANALYSIS USING TABLEAU

This project includes Exploratory Data Analysis and Data Visualization on Power Supply and Demand data across the states of India over a period of 2014 -2018 using TABLEAU.

Data Source:

Data was downloaded form Open Government Data Portal.

Insights:

(Including only a few insights, other insights included in the Code File. )

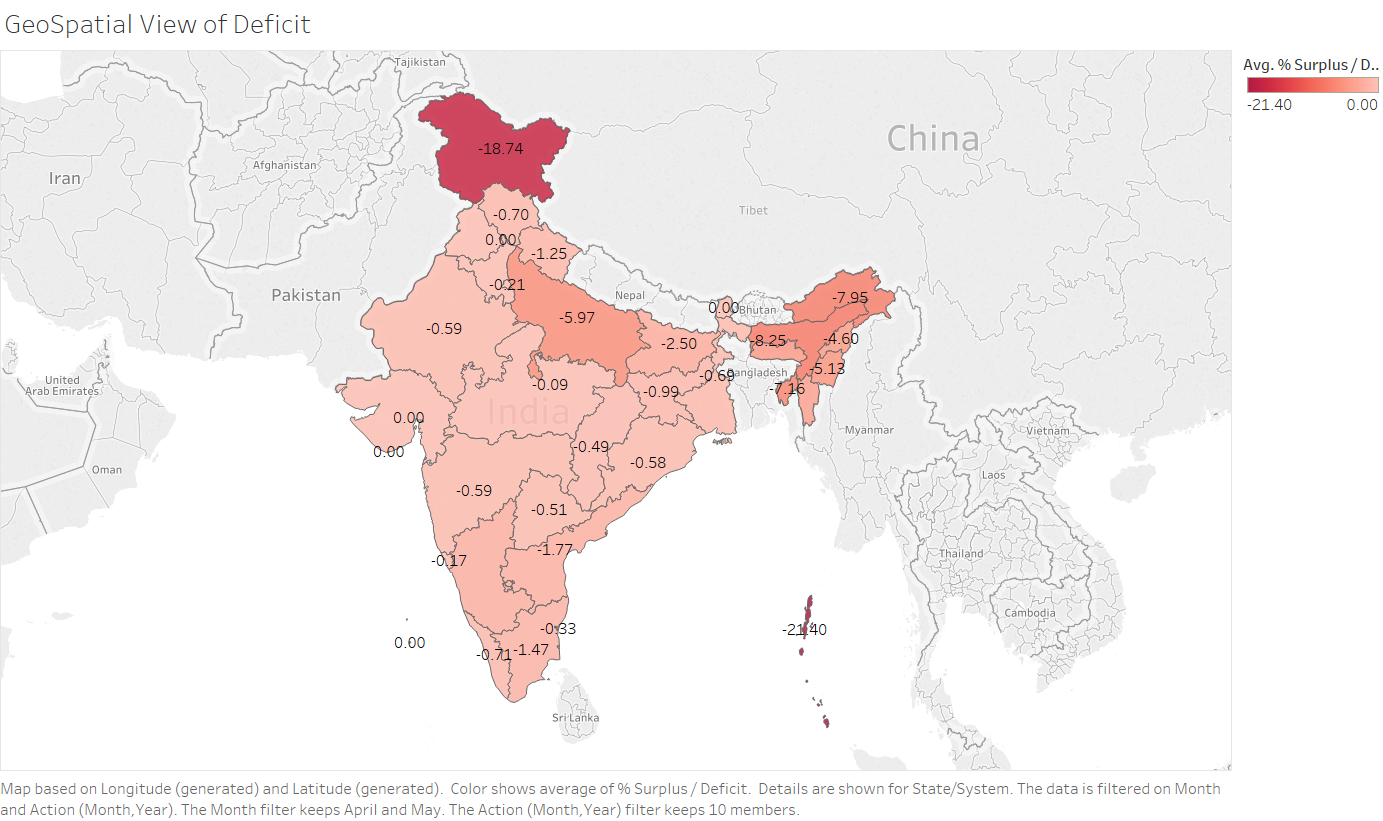
  1. Geographical Symbol Maping of Surplus/Deficit in Percent.

geo

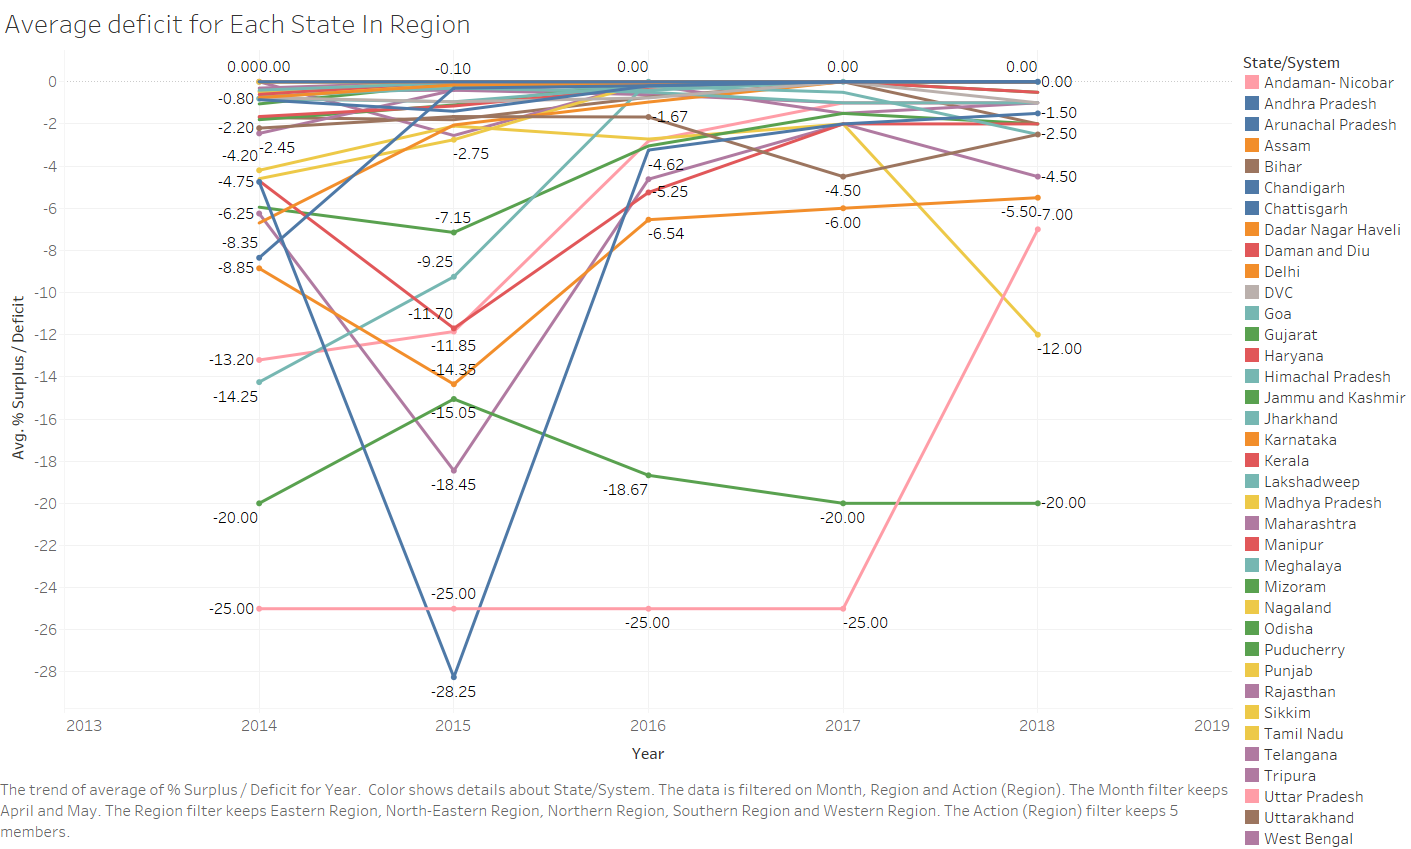
  1. Line Plot of Average Surplus/Deficit in Percent.

avg

  1. Horizontal Bar Graph of Requirements as per State every year.

statereq

About

Data Visualization of Power Suppy and Demand in India using Tableau.

Topics

Resources

Stars

Watchers

Forks

Releases

No releases published

Packages

No packages published