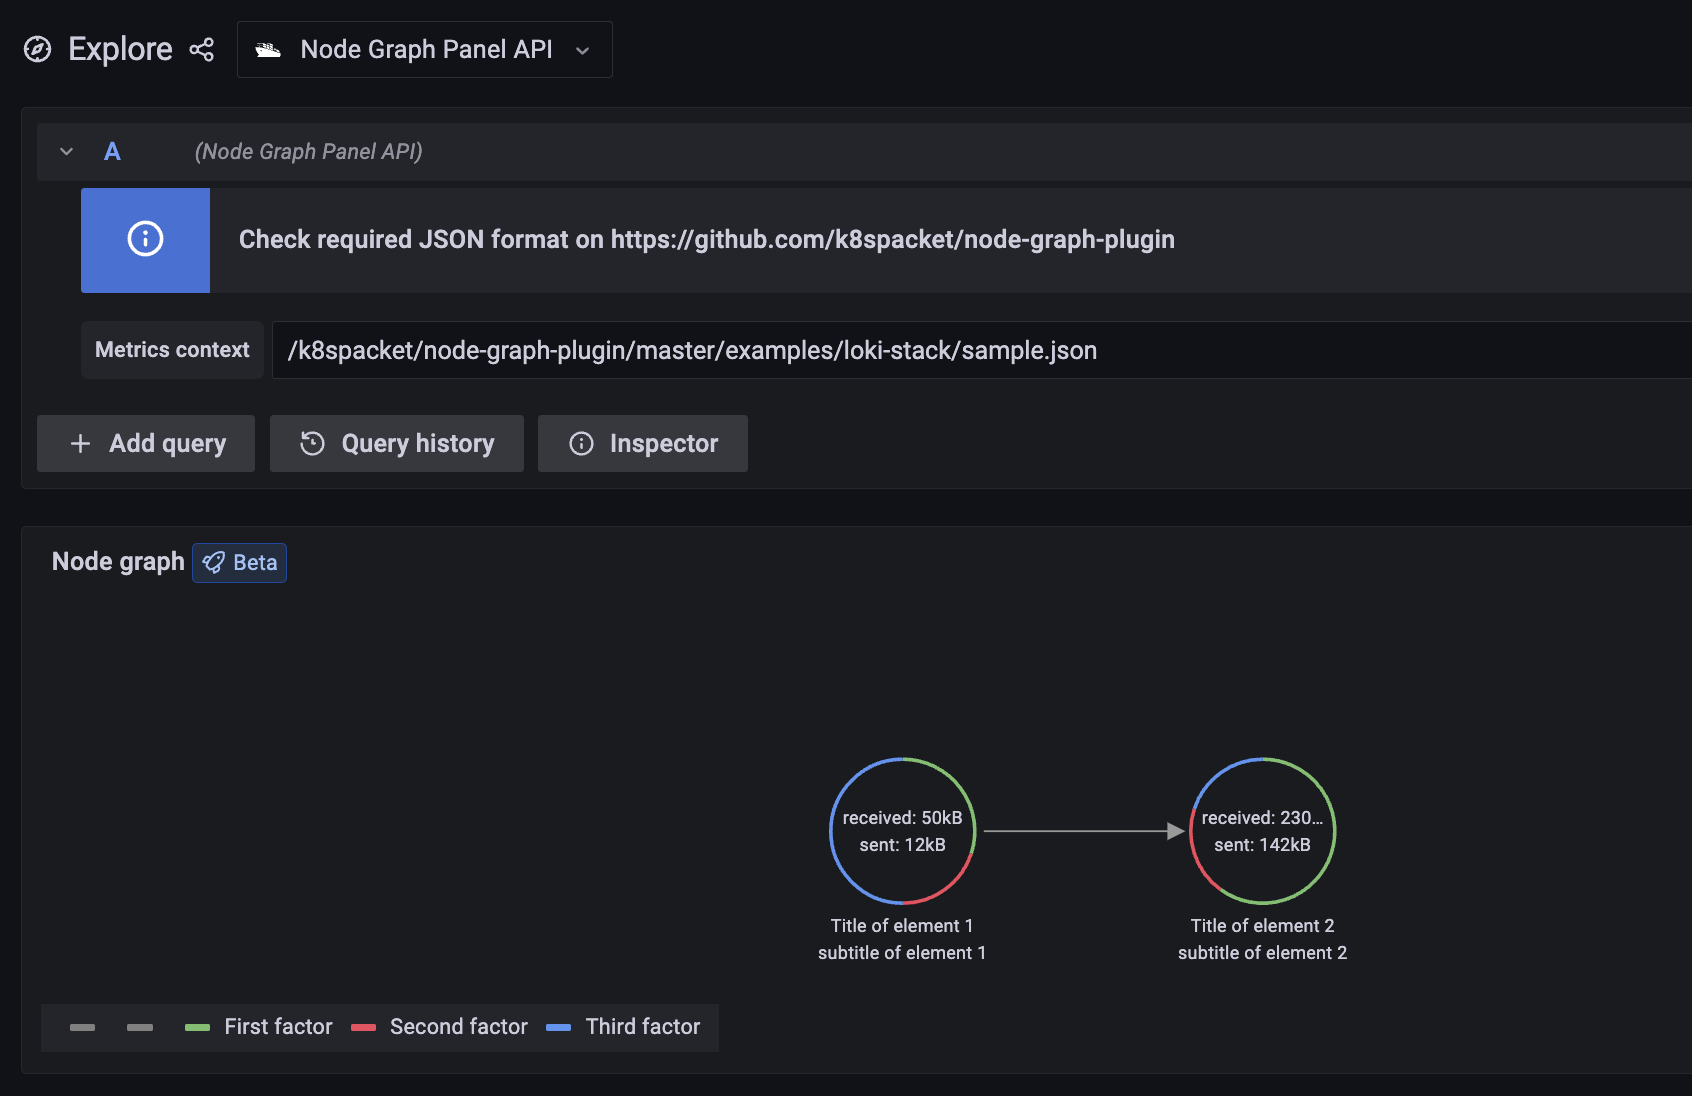
Datasource plugin to visualize data as Node graph panel for Grafana (https://grafana.com/docs/grafana/latest/visualizations/node-graph/)
{
"config":{
"arc__1":{
"displayName":"First factor",
"color":"green"
},
"arc__2":{
"displayName":"Second factor",
"color":"red"
},
"arc__3":{
"displayName":"Third factor",
"color":"blue"
},
"mainStat": {
"displayName": " ",
"color": ""
},
"secondaryStat": {
"displayName": " ",
"color": ""
}
},
"nodes":[
{
"id":"id1",
"title":"Title of element 1",
"subTitle":"subtitle of element 1",
"mainStat":"received: 50kB",
"secondaryStat":"sent: 12kB",
"arc__1":0.3,
"arc__2":0.2,
"arc__3":0.5
},
{
"id":"id2",
"title":"Title of element 2",
"subTitle":"subtitle of element 2",
"mainStat":"received: 230MB",
"secondaryStat":"sent: 142kB",
"arc__1":0.6,
"arc__2":0.2,
"arc__3":0.2
}
],
"edges":[
{
"id":"id1-id2",
"source":"id1",
"target":"id2",
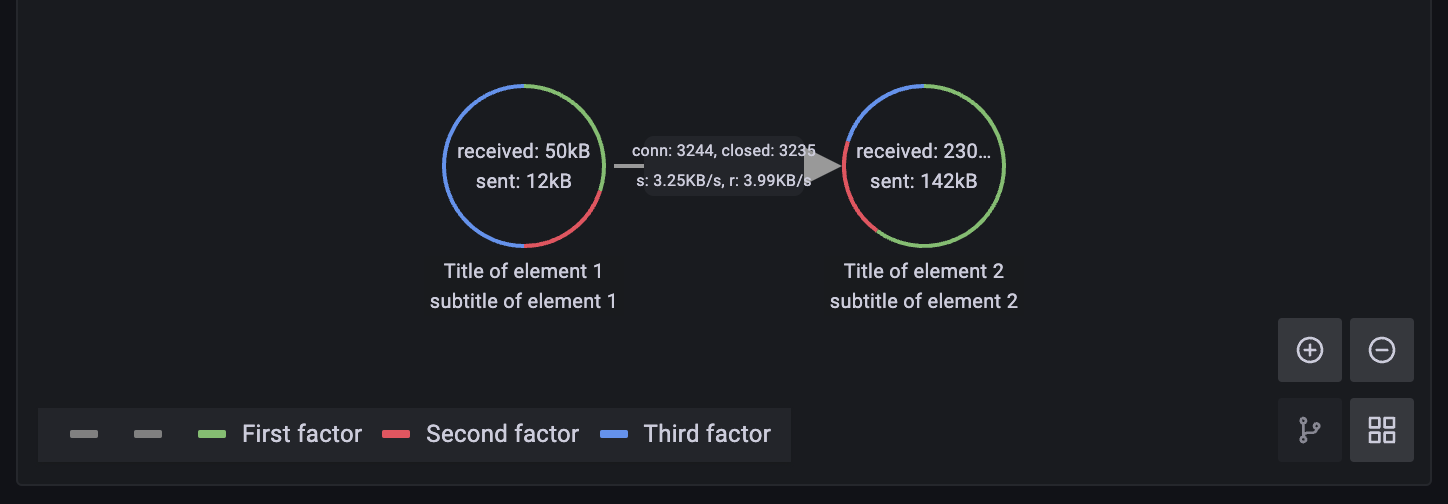
"mainStat":"conn: 3244, closed: 3235",
"secondaryStat":"s: 3.25KB/s, r: 3.99KB/s"
}
]
}- nodes and edges correspond with nodes and edges in the Node graph panel
- config defines colors on circles and legend on panel
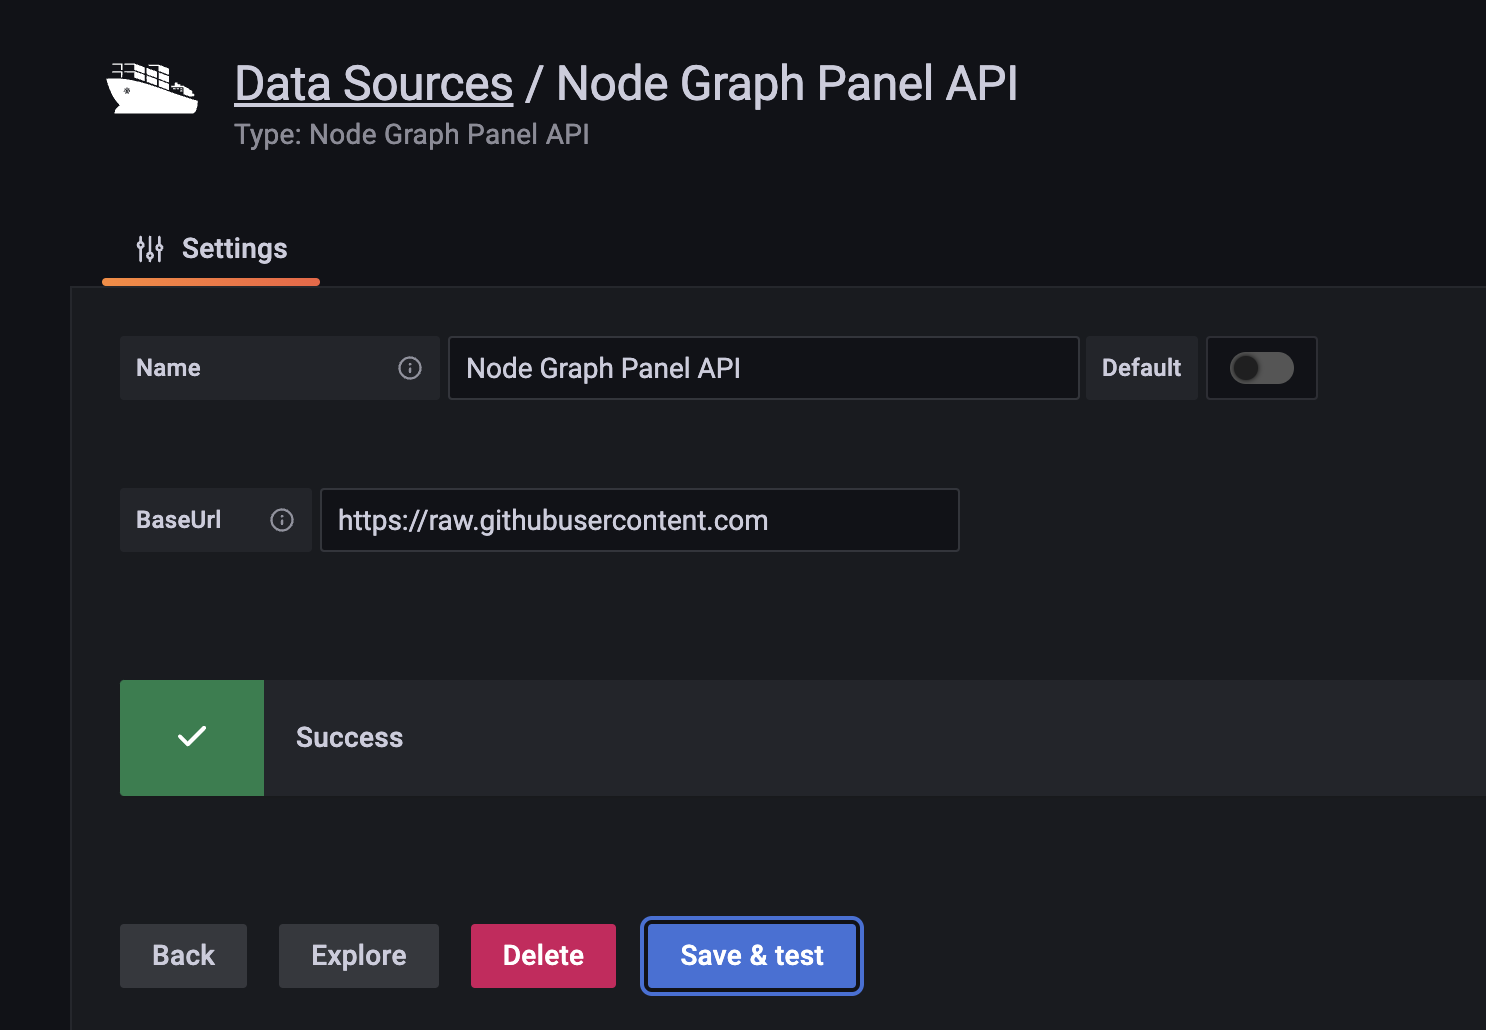
To install the plugin see the example for loki-stack
Add and configure datasource plugin in your Grafana instance
As baseUrl you can enter URL to your metrics service API
Go to Explore, select Node Graph Panel API as datasource, and provide context of metrics endpoint