Plotly.java is a Java wrapper for the Plotly JavaScript open source graphing library, one of the finest graphing libraries available. Plotly.java lets you generate a wide range of JavaScript/HTML charts. Please note that Plot.ly (the company) did not develop and does not support plotly.java (the library) in any way, other than to create the beautiful library that we use.
Plotly.java was developed as part of the Tablesaw Java dataframe library. It has been used since 2018 in numerous projects, and was originally created as a tool for exploratory data analysis that would complement the dataframe's data wrangling abilities.
All dependencies on Tablesaw have been removed to make it easier to incorporate visualizations into a broad range of Java applications, but it remains a key part of the Tablesaw solution. If you need to plot data from a CSV, Excel file, database, JSON, etc., we strongly recommend you take a look at Tablesaw for data ingestion and transformation support, as well as for descriptive statistics.
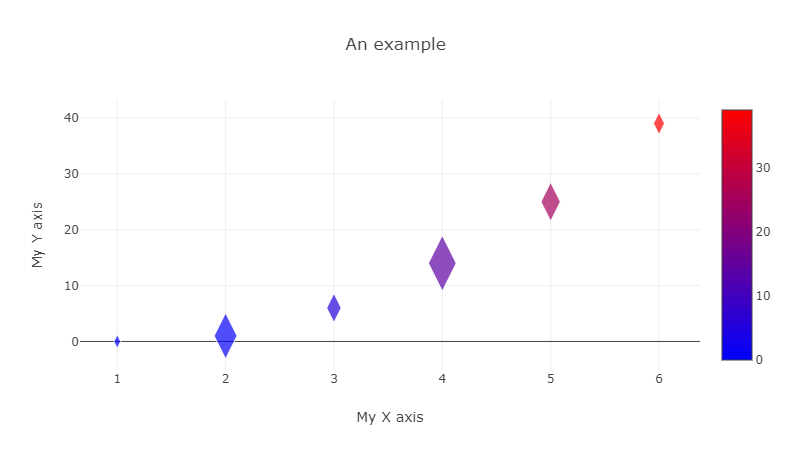
Here's a simple example that creates a Bubble Plot with diamond-shaped markers. Two double arrays are used to specify the x and y coordinates. A third sets the size of the bubble. Colors are defined by the color scale shown at the left, which is applied to the y coordinates of each point.
The code to create this image is shown below.
import tech.tablesaw.plotly.Plot;
import tech.tablesaw.plotly.components.*;
import tech.tablesaw.plotly.traces.ScatterTrace;

class Scratch {

    private static final double[] x = {1, 2, 3, 4, 5, 6};
    private static final double[] y = {0, 1, 6, 14, 25, 39};
    private static final double[] size = {10.0, 33.0, 21.0, 40.0, 28.0, 16.0};

    public static void main(String[] args) {
        ScatterTrace trace =
                ScatterTrace.builder(x, y)
                        .mode(ScatterTrace.Mode.MARKERS)
                        .marker(
                               Marker.builder()
                                  .size(size)
                                  .showScale(true)
                                  .color(y)
                                  .colorScale(Marker.Palette.BLUE_RED)
                                  .symbol(Symbol.DIAMOND_TALL)
                                  .build())
                        .build();
        Layout layout = Layout.builder()
                .title("An example")
                .xAxis(Axis.builder().title("My X axis").build())
                .yAxis(Axis.builder().title("My Y axis").build())
                .build();
        Plot.show(Figure.builder(trace).layout(layout).build());
    }
}````
As you can see, plotly.java has a builder API, that lets you configure each plot exactly as you want, while retaining Java's type safety.
A complete plot in Plot.ly is called a Figure. It can have several elements, the most important of which are layouts and traces.
- Layout defines the attributes that determine the appearance of the overall plot- like its title and its height and width (if you don't want a responsive plot).
- Trace defines the attributes that determine the appearance of a single data series. A line plot for example, may have two traces, where one represents the GDP of Germany, and the other the GDP of France. Similarly, if you want to overlay two histograms on the same plot, each Histogram will be it's own trace.
Two other elements of Figures are Configs and Events. You can learn about those in the Plot.ly documentation (see below). From here on, we will use the term plot and figure interchangeably to refer to a single figure. Note, however, that plotly allows you to combine figures in various ways.
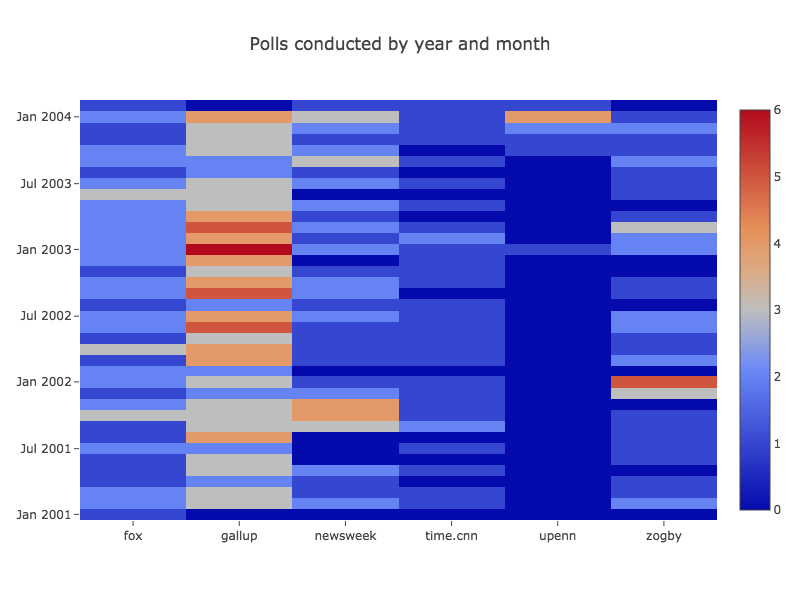
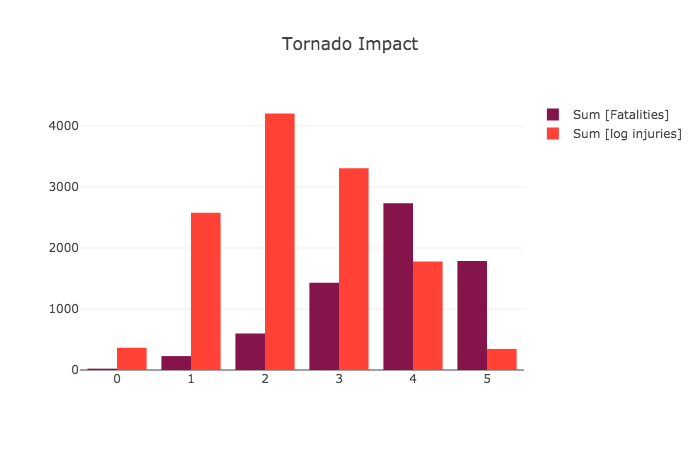
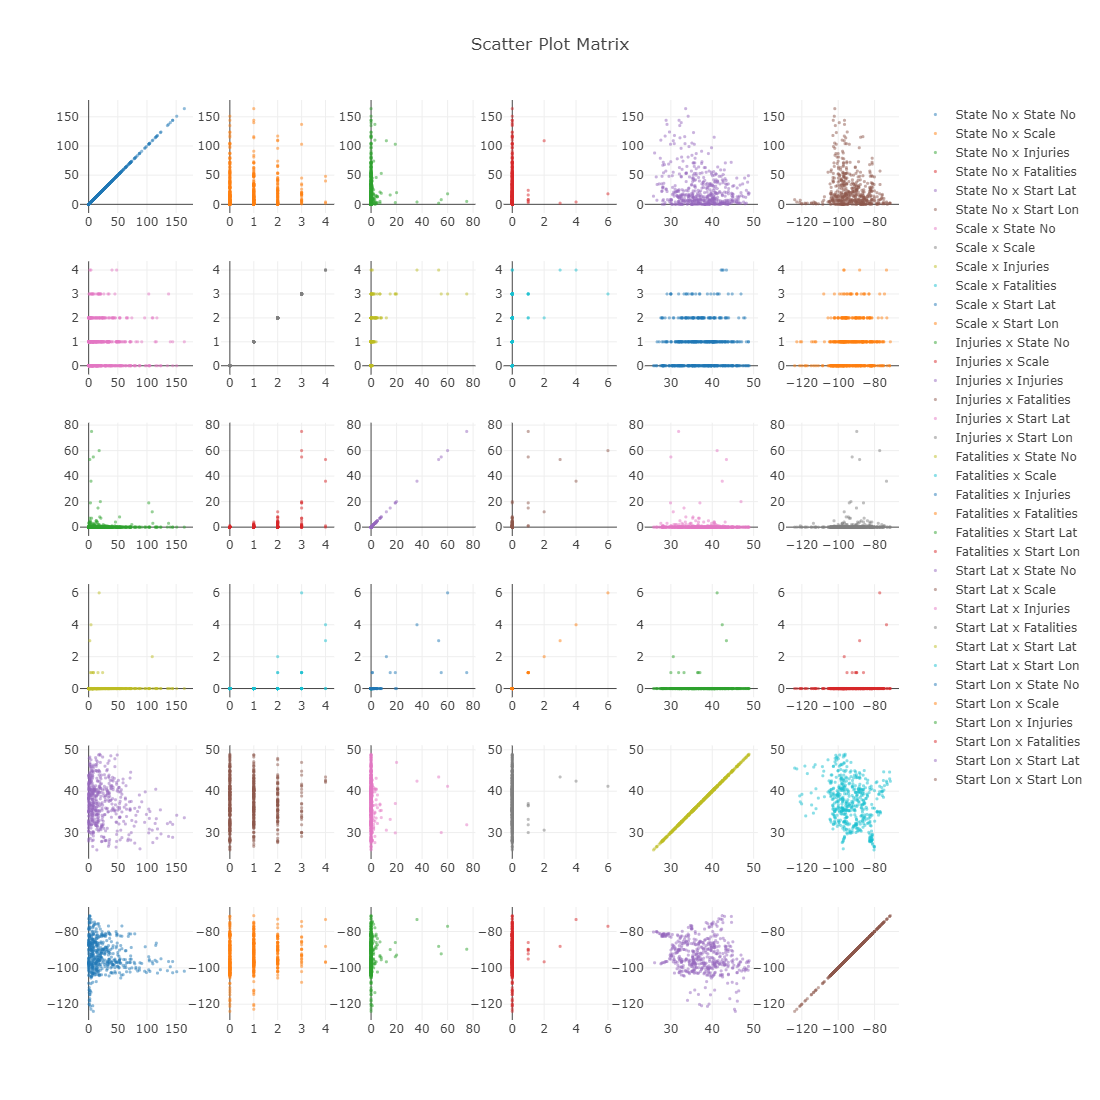
Here are some examples of plots that were created using plotly.java.
| Examples | 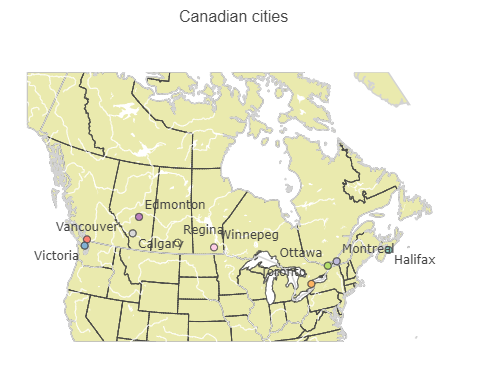 Scatter map Scatter map |
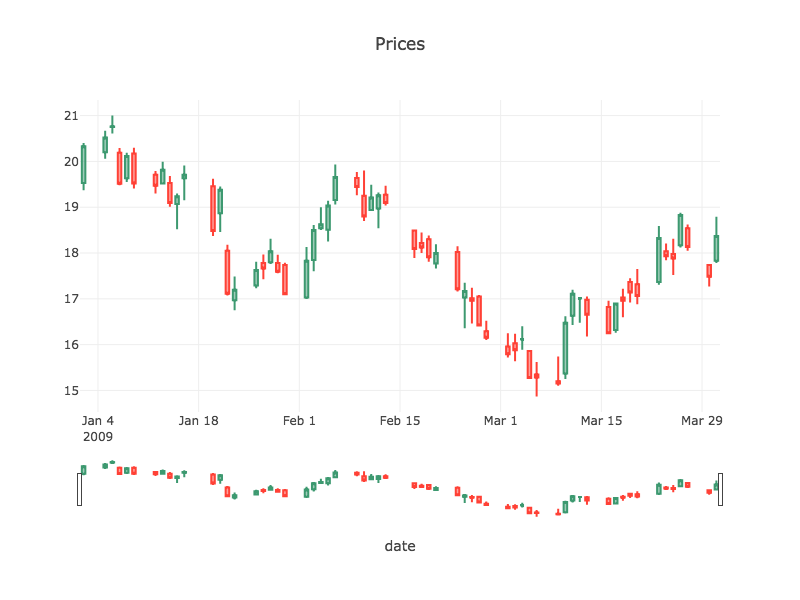 Candlestick plot Candlestick plot |
|---|---|---|
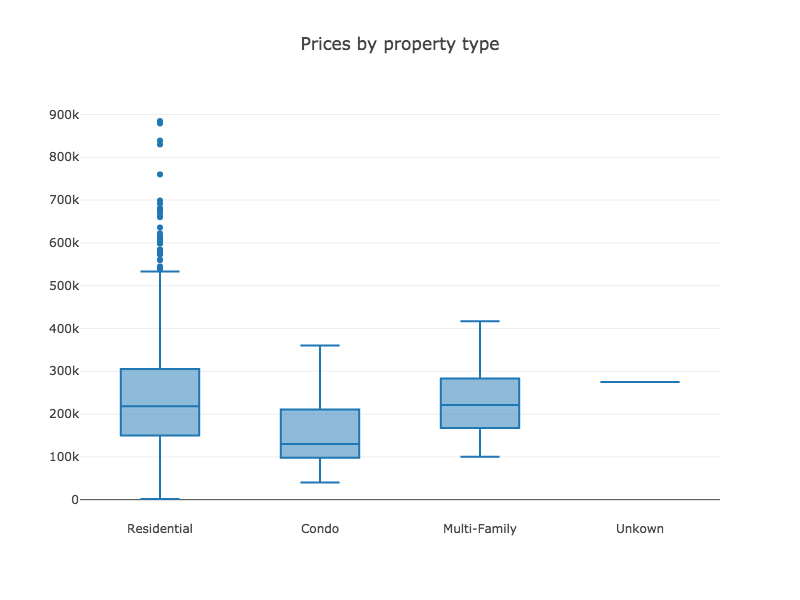 Box plot Box plot |
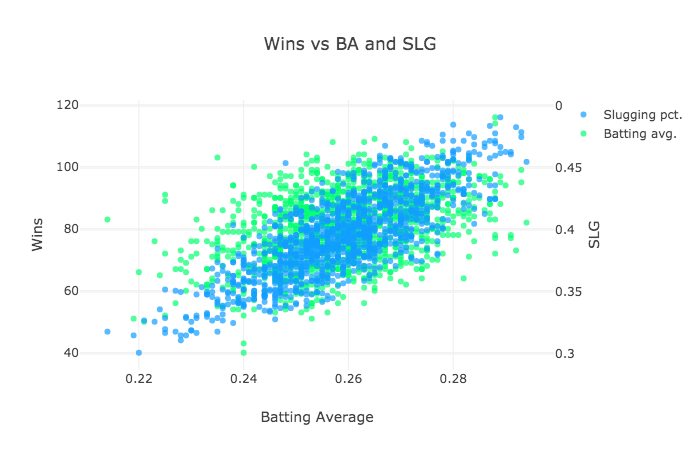 Scatter plot Scatter plot |
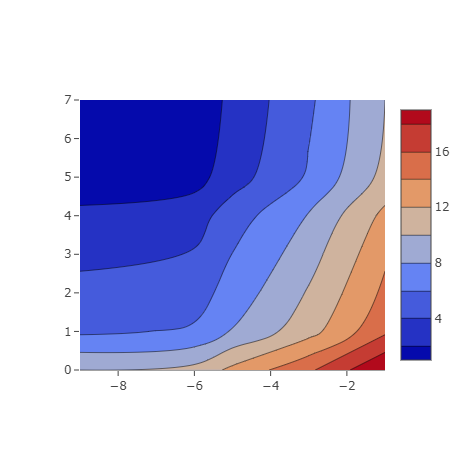 Contour plot Contour plot |
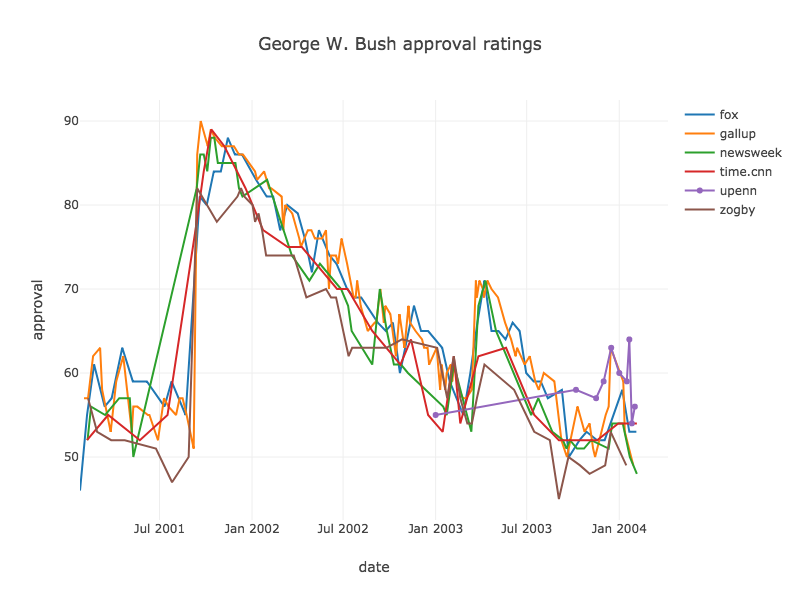 Time series plot Time series plot |
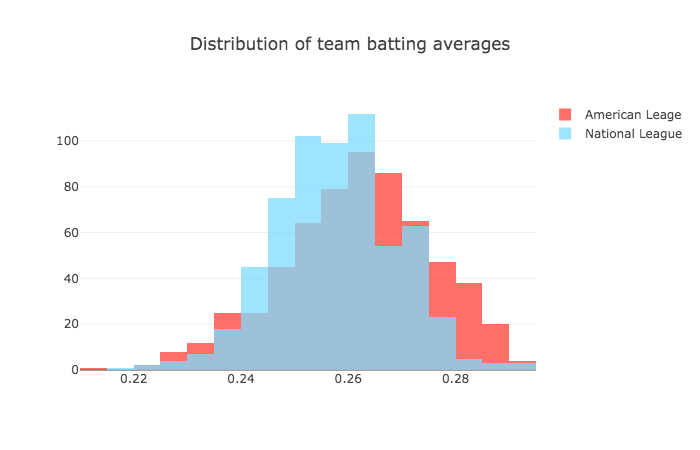 Histogram Histogram |
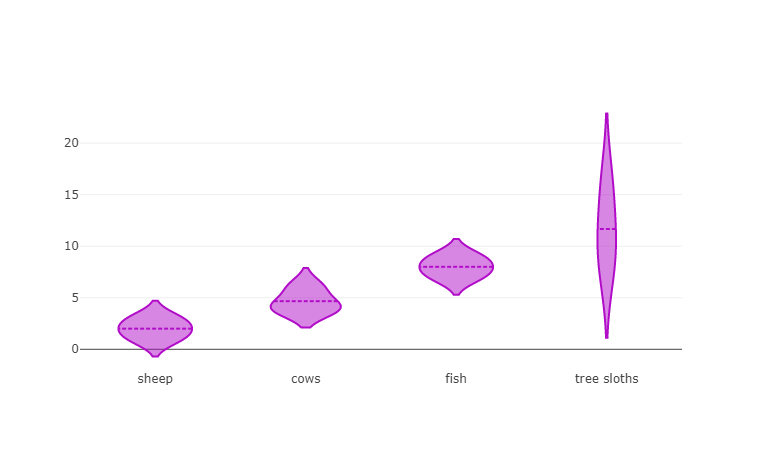 Violin plot Violin plot |
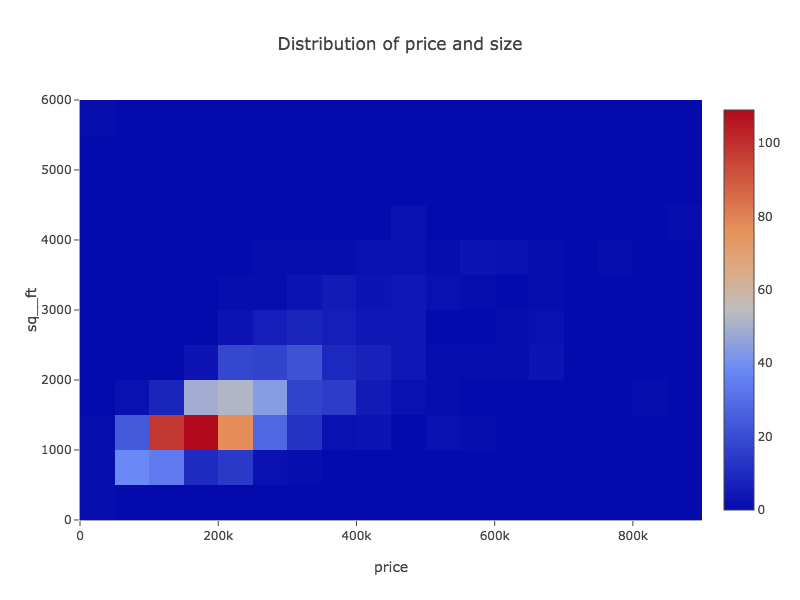 Heatmap Heatmap |
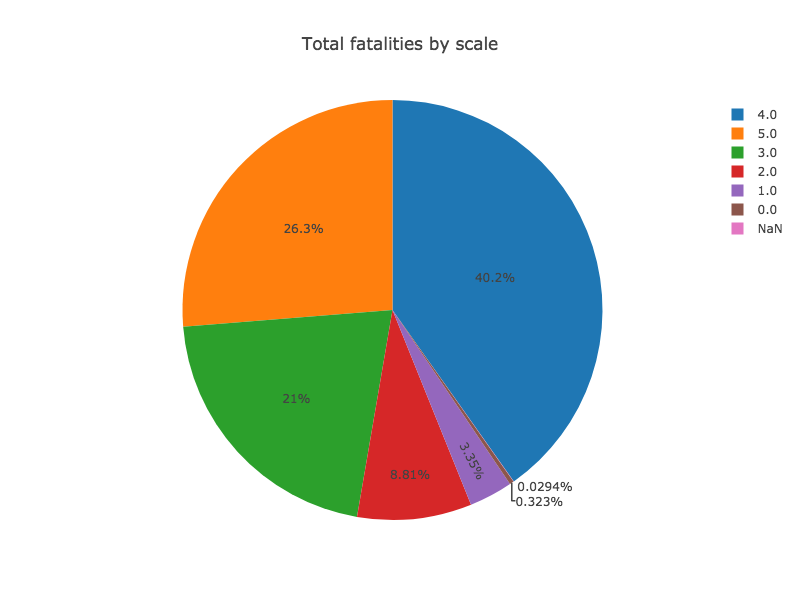 Pie chart Pie chart |
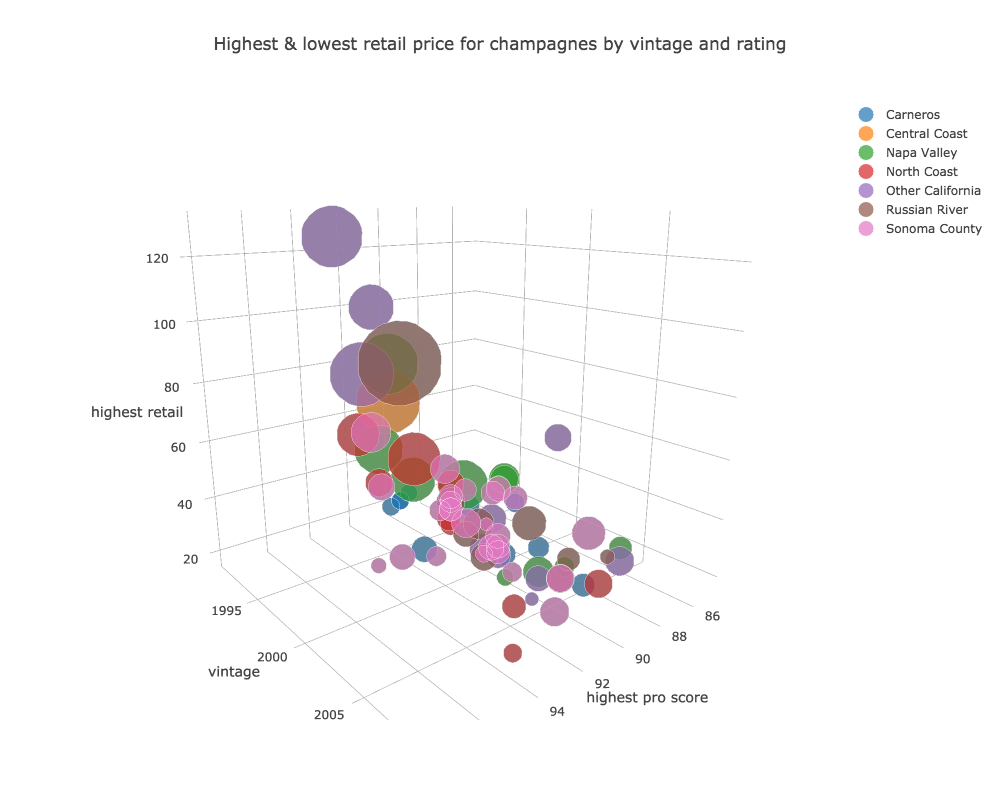 3D bubble plot 3D bubble plot |
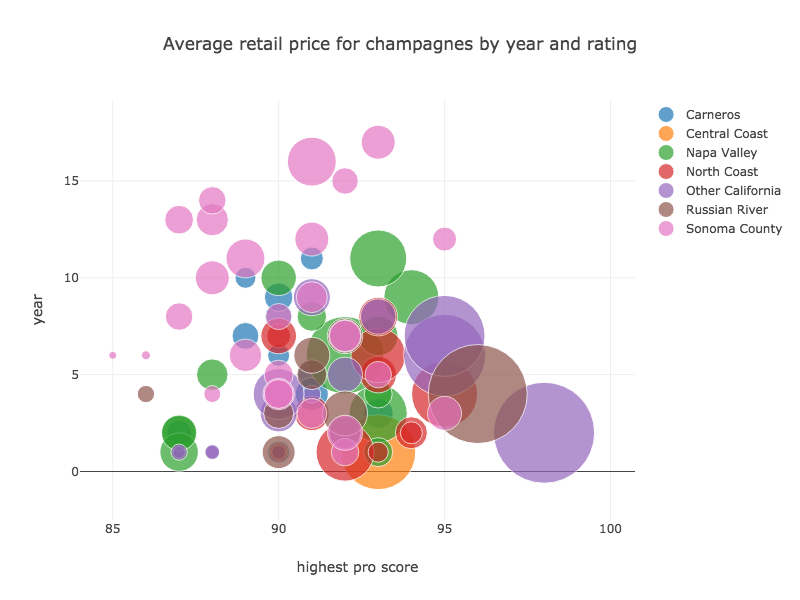 2D bubble plot 2D bubble plot |
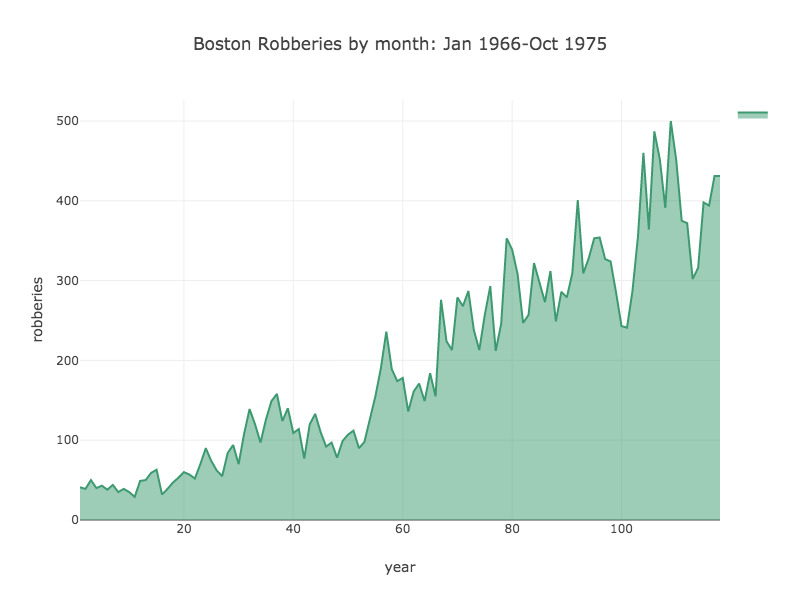 Area plot Area plot |
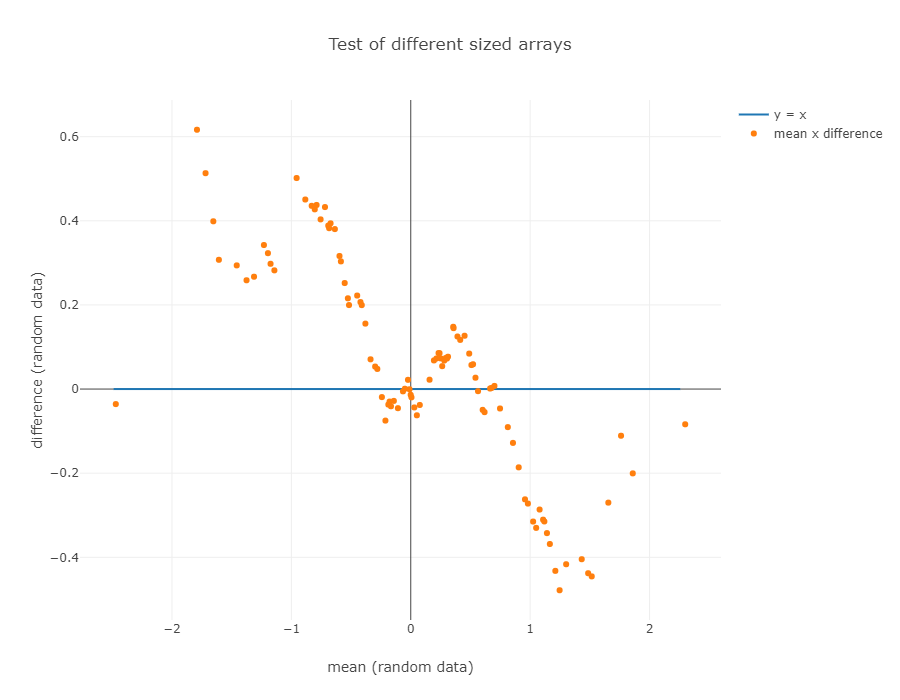 Tukey Mean-Distribution plot Tukey Mean-Distribution plot |
 2D histogram 2D histogram |
 Bar plot Bar plot |
 OHLC (open, high, low, close) plot OHLC (open, high, low, close) plot |
Since Plotly is a JavaScript library, rendering is ultimately handled by a browser. There are several ways:
- Embed a figure in a static web page.
- Send a figure to a browser from a Web app.
- Render a figure in your desktop's default browser from your IDE.
- Render a figure in a Jupyter Notebook
Each of these is described below.
To embed a figure in a static web page, you need to get the JavaScript code from your Figure object. Simply construct a figure as show above, get the JavaScript by calling
String s = figure.asJavascript(); You can print the contents of s to your console and paste it into your Web page.
The details of this will vary depending on which Web framework you use, but the approach is similar to the static approach shown above. You construct the plot in Java, get the JavaScript for the figure by calling
This method is best if you're looking at data interactively in your IDE. The Plot class used on the last line in the example above shows how. Plot is simply a helper class with several methods called show() that write out an HTML file to your local disk, find your default browser, and tell it to open that HTML page in a new browser tab. As shown above, the simplest version is
Plot.show(figure));See the Plot class for more information on the other varieties.
You can use plotly.java in a Jupyter Notebook with one of several Java kernals for Jupyter. While we don't yet have documentation for using this library, examples for using the older Tablesaw version plotly.java should help get you started.
- To use the Beakerx kernal, see these instructions for installing BeakerX and trying the sample Tablesaw notebook
- To use the IJava kernal, which has built-in support for Tablesaw, see this tutorial by Gary Sharpe that shows you how to use Tablesaw plots. Gary has written a number of other tutorials that feature Tablesaw.
Add tablesaw-plotly-java to your project. You can find the version number for the latest release in the release notes:
<dependency>
    <groupId>tech.tablesaw</groupId>
    <artifactId>tablesaw-plotly-java</artifactId>
    <version>VERSION_NUMBER_GOES_HERE</version>
</dependency>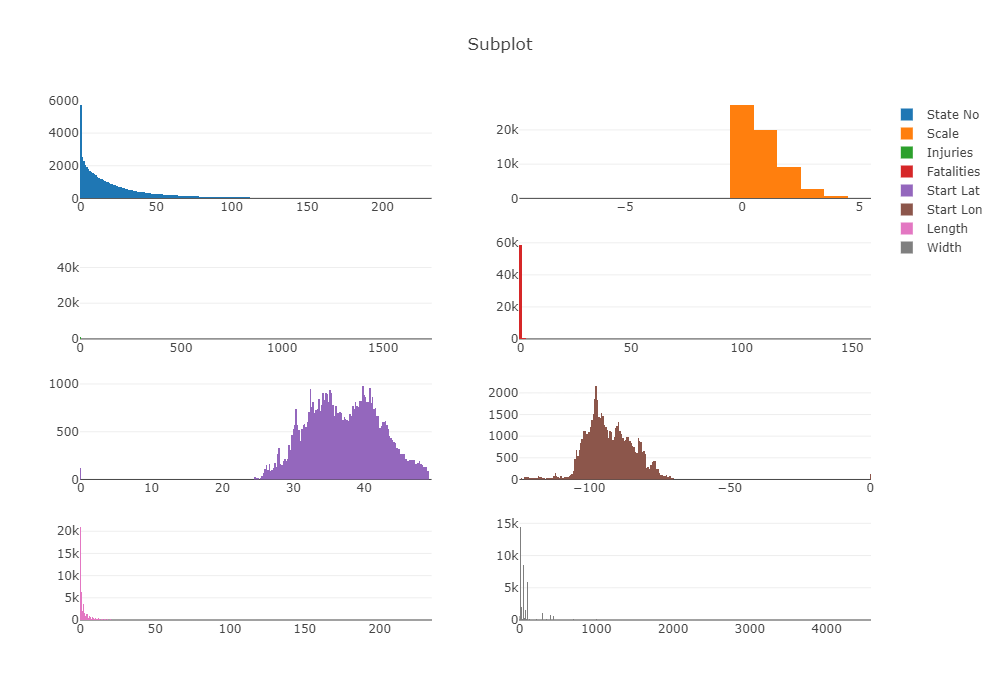
The best source of documentation is the Plotly.js library documentation as everything in plotly.java exists solely to generate and render plotly.js code.
-
Examples of many chart types can be found here: https://plotly.com/javascript/.
-
Plotly's figure reference can be found here. https://plotly.com/javascript/reference/index/
-
The single-page reference is very useful if you want the details of some plotly component, like an axis, marker, or tick mark.https://plotly.com/javascript/reference/
Plotly.java is free and open source software made available under the Apache 2 license.
Ploty.js (a required dependency) is licensed under the MIT license.
The best way to ask questions is to use the Github Discussions feature.
You are also welcome to try Stack Overflow as well. If you use Stack Overflow, please tag your question with plotly.java so we're more likely to see it.
Please create an issue here.
There are SO many ways to contribute.
To contribute code: please see the open issues for any bugs and a list of desired enhancements. We always want to support more plot types. If you are interested in contributing regularly, let us know. We are always looking for additional maintainers.
To help spread the word: Let people know about plotly.java through your blog, through twitter, YouTube, Instagram or whatever. If you create a tutorial or some nice examples let us know and we will link from this page. We LOVE people who post examples.
If you create any nice plots, please share them in the Discussions section, and tag the with the "Show and Tell" category.
Thank you for you support.