A 3D surface-plot Schrodinger-equation quantum wave function visualization.
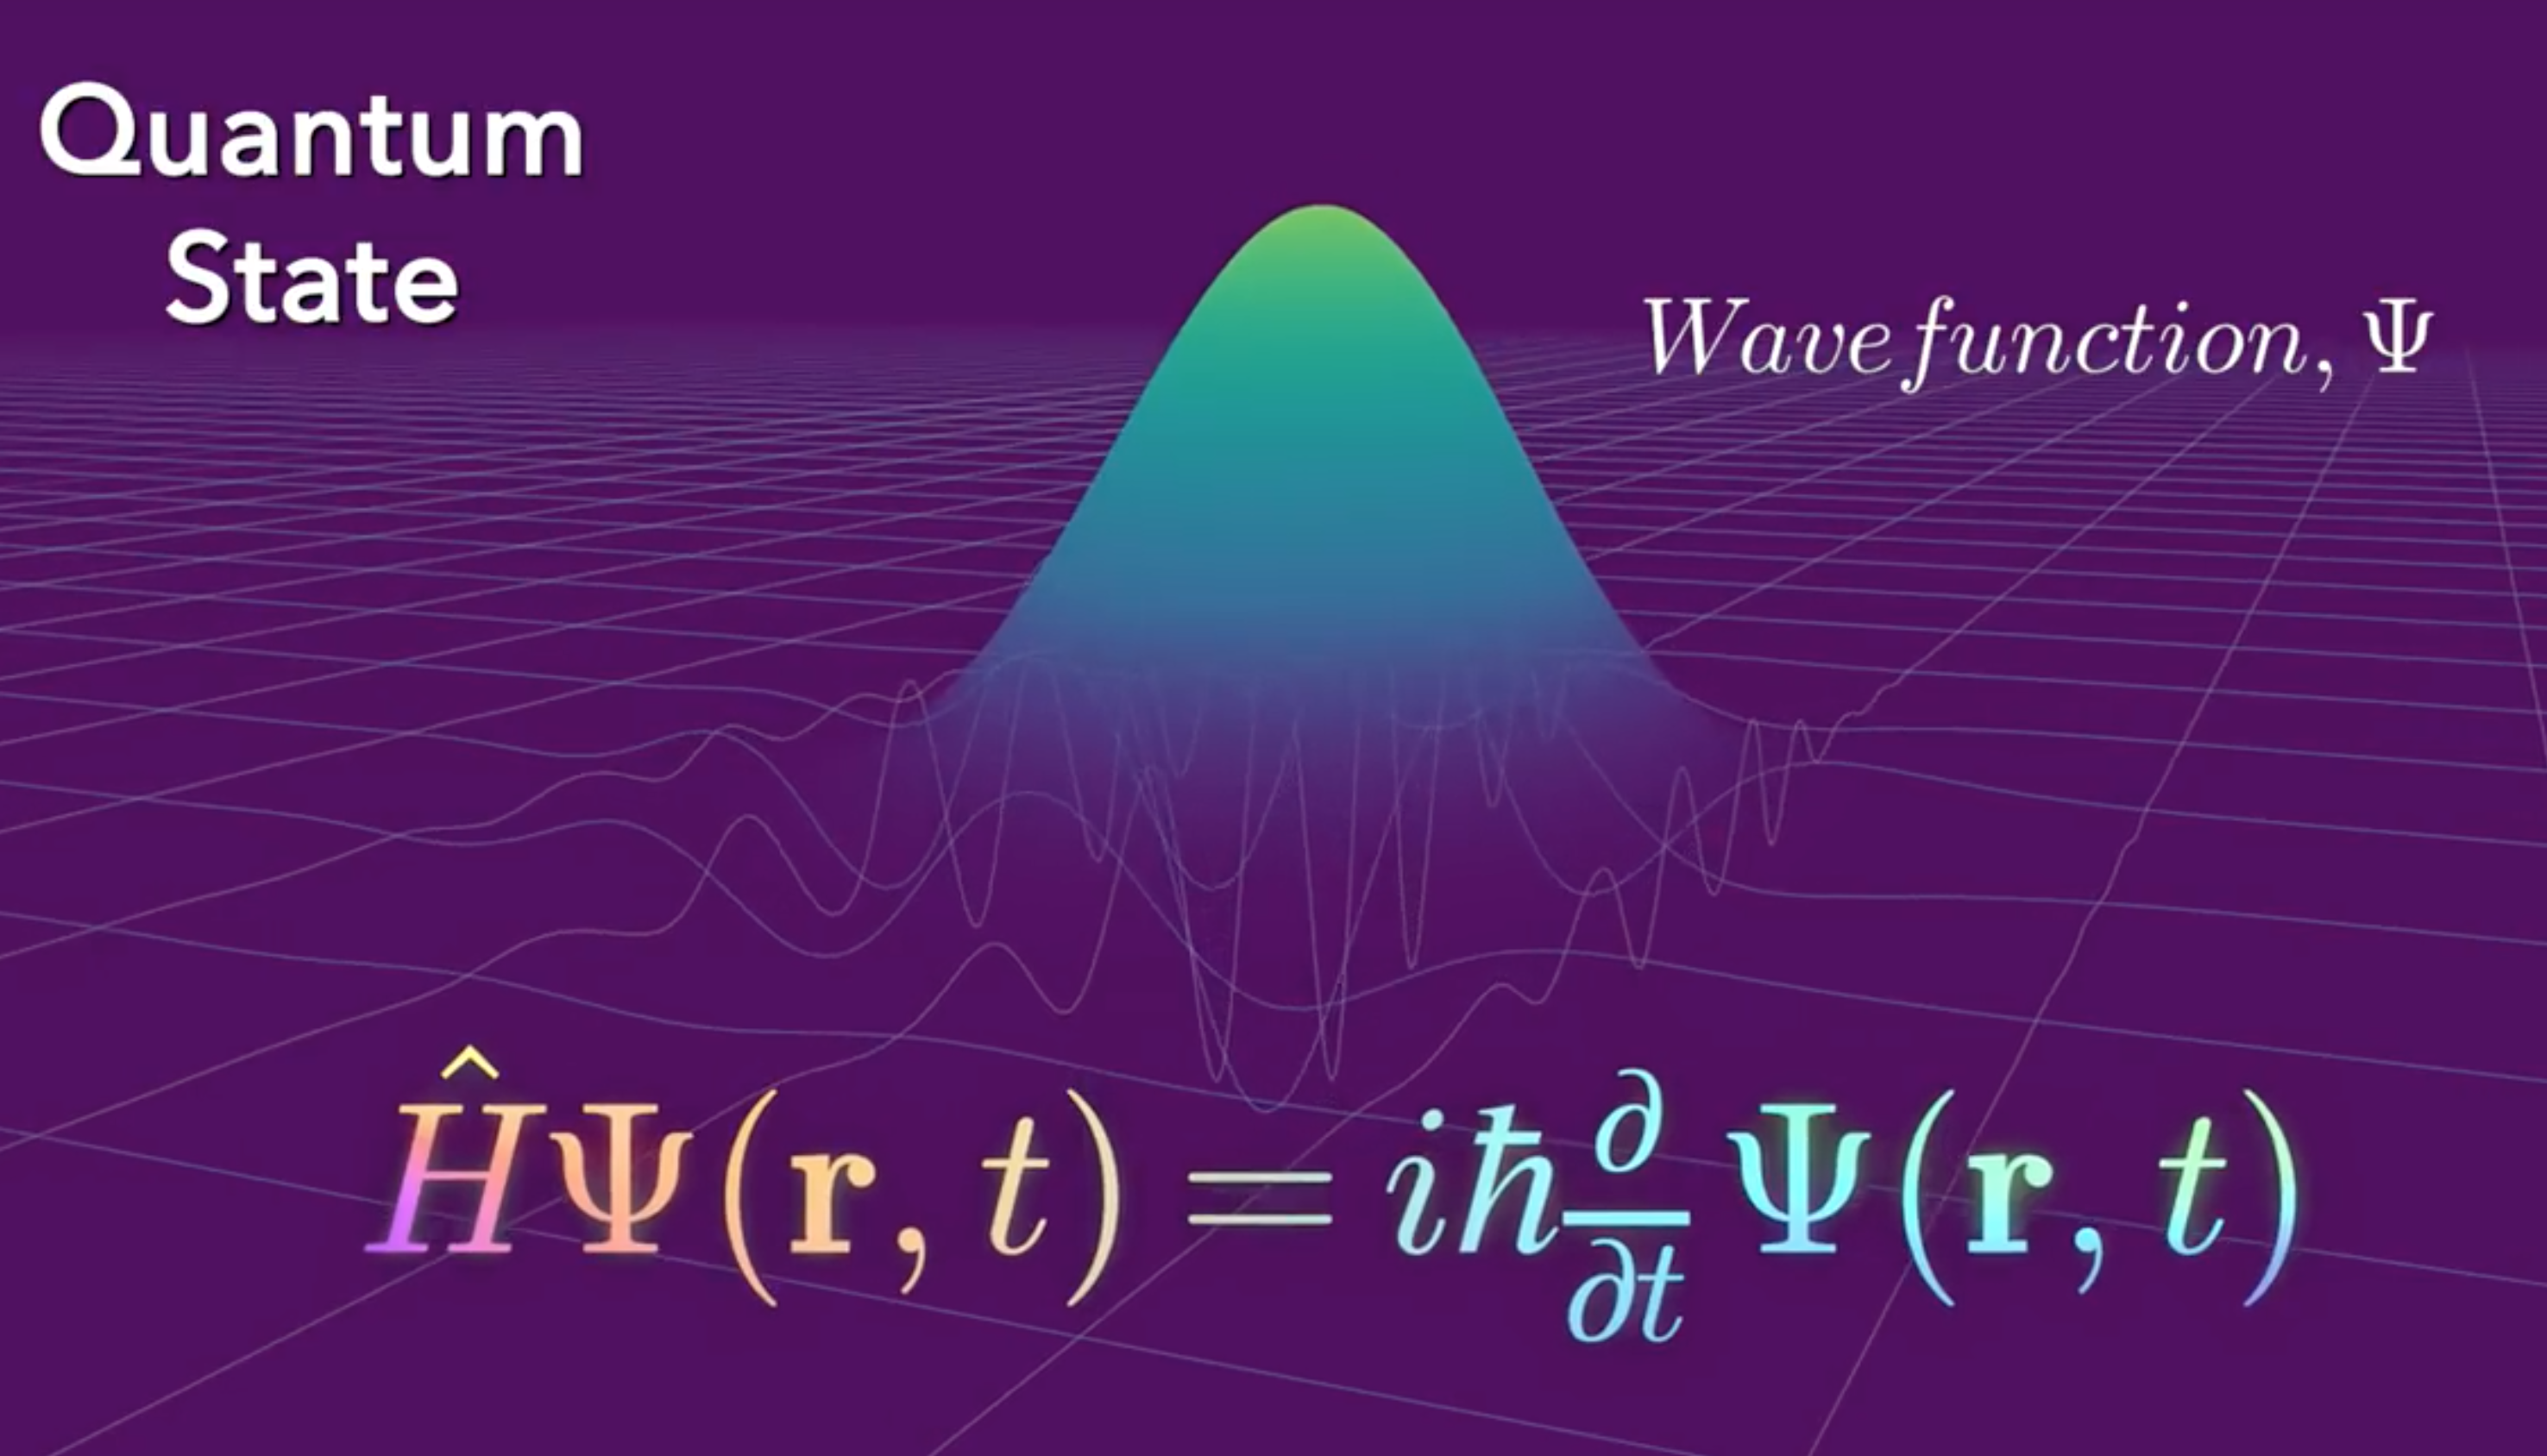
- Surface represents probability density function
- Lines on the x and y axes represent real and imaginary waves.
This code is extremely messy because it was hand-crafted for a one-off visualization! I share it here in the case its useful for anyone in the future - but it's woefully undocumented and will not be supported in the future!
The video this visualization appeared in can be watched here!
Simulation code is in schrodinger/schrodinger.py folder, based heavily on this code by Azercoco
Visualization code is in quantumwaves.py and utilizes pyqtgraph primarily, using its OpenGL capabilities.
Note that I also configured pyqtgraph internally to use multisampling frame buffers for antialiasing (MSAA 8x)
CODE PUBLISHED UNDER MIT LICENSE
Hope it's useful!