rigolrdout is a tool that can connect to your Rigol oscilloscope (at least to a 1000Z series) via LAN and read out screen grabs or data and write them to local files.
Using rigolrdout is very straightforward. To grab all data from the scope, simply type something like
$ ./rigolrdout -c tcpip:ds1000z --include-hardcopy --comment "Example #1" \
               --output-format=json -o output.json
This will connect via TCP/IP to the hostname "ds1000z" (any IP address would work as well instead) and it will create a screen shot (hard copy) of the current display, grab all information from the scope (all memory and all memory metadata) and write everything in one large output.json file. The command line comment will be included.
Alternatively, you can have the output-format "files", which will create
multiple files: output_hardcopy.png for the requested hardcopy,
output_waveform-chX.bin for every channel that was enabled and
output_meta.json in which all metadata is collected.
For more information on how to useJust type ./rigolrdout --help:
$ ./rigolrdout --help
usage: rigolrdout [-h] -c conn_str [-f {json,files}] [--comment comment]
                  [--include-hardcopy] [--no-serial] -o file [-v]

optional arguments:
  -h, --help            show this help message and exit
  -c conn_str, --connect conn_str
                        Specify where to connect to. Can be something like
                        "tcpip:192.168.1.4". Currently the only supported
                        driver is "tcpip". Mandatory argument.
  -f {json,files}, --output-format {json,files}
                        Specify output filetype. Can be one of json, files,
                        defaults to files.
  --comment comment     Add comment to output metadata.
  --include-hardcopy    Include a hardcopy (screenshot) of the oscilloscope
                        screen in the result.
  --no-serial           Do not include device's serial number in the metadata.
  -o file, --output file
                        Specify output filename. Mandatory argument.
  -v, --verbose         Increase level of debugging verbosity.
The nicest data is useless if there isn't a way to manipulate it. For this, use
rigolplot. It can either create PNG files from the contained hardcopy images
or PNGs or Gnuplot render files from the waveform data. Example:
$ ./rigolplot example/inline.json inline.png
Will plot all waveforms to the given PNG file. More options are possible, of course:
$ ./rigolplot --width 1920 --height 1080 --smooth-waveform --x-unit u \
              example/inline.json inline.png
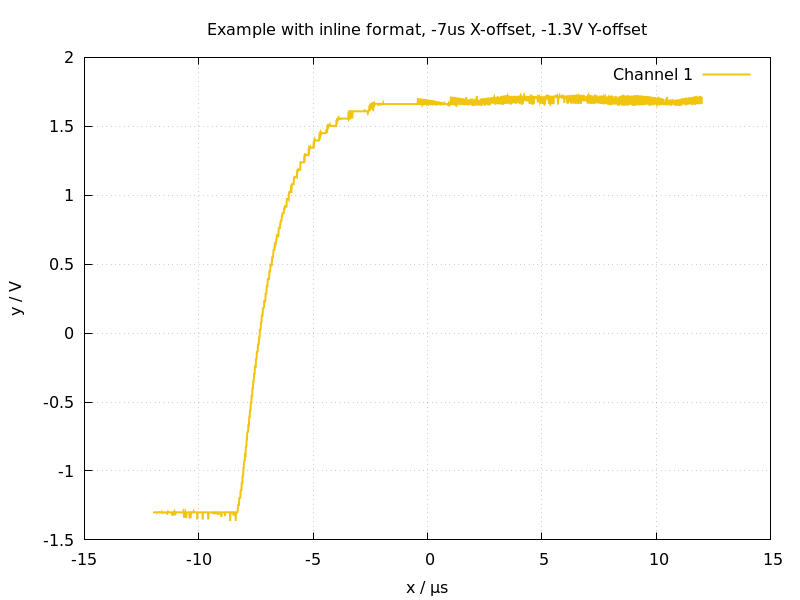
Will render a 1920x1080 waveform plot with the X unit in µs. Here's an actual example rendered with rigolplot:
$ ./rigolplot --honor-offsets --x-unit u --smooth-waveform --width 800 --height 600 \
              example/inline.json example/inline.png
Renders this image:
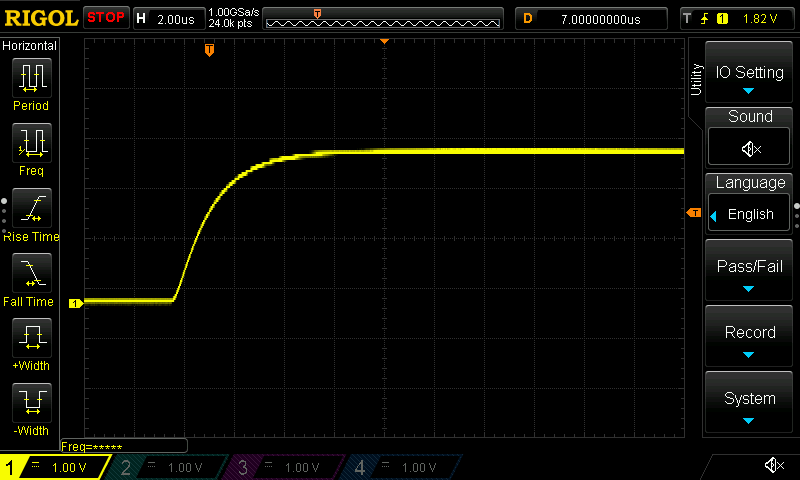
If you want to extract the simultaneously captured hardcopy from the inline file, you can do so as well:
$ ./rigolplot -t hardcopy example/inline.json example/inline_hardcopy.png
This is what it looks like:
There's also a quite self-explanatory help page:
usage: rigolplot [-h] [-t {waveform,hardcopy}] [-f {png,gnuplot}] [-s path]
                 [--width pixels] [--height pixels] [--x-unit {m,u,n}]
                 [--y-unit {m,u,n}] [--smooth-waveform] [--honor-offsets] [-v]
                 infile outfile

positional arguments:
  infile                The input JSON filename.
  outfile               The outputfilename.

optional arguments:
  -h, --help            show this help message and exit
  -t {waveform,hardcopy}, --output-type {waveform,hardcopy}
                        Specify output content. Can be one of waveform,
                        hardcopy, defaults to waveform.
  -f {png,gnuplot}, --output-format {png,gnuplot}
                        Specify output filetype. Can be one of png, gnuplot,
                        defaults to png.
  -s path, --search-path path
                        When searching for external references, usually the
                        directory of the input file is looked at. This allows
                        specifying a different directory.
  --width pixels        Width when plotting a gnuplot graph, in pixels.
                        Defaults to 1280.
  --height pixels       Height when plotting a gnuplot graph, in pixels.
                        Defaults to 960.
  --x-unit {m,u,n}      Plot X axis with given unit (milli, micro, nano);
                        choices are m, u, n, defaults to no SI-prefix.
  --y-unit {m,u,n}      Plot Y axis with given unit (milli, micro, nano);
                        choices are m, u, n, defaults to no SI-prefix.
  --smooth-waveform     Apply cubic spline interpolation to waveform before
                        plotting.
  --honor-offsets       By default, waveforms are plotted with the actually
                        measured values. If they have been shifted in X or Y
                        direction in the oscilloscope, this will therefore not
                        appear in the plot. This option causes these offsets
                        to be honored and included in the final plot.
  -v, --verbose         Increase level of debugging verbosity.
The file format is ridiculously easy to understand -- basically it's carrying
all the raw information from the scope over to a JSON file. There's examples of
the inline format and the external format in the example/ subdirectory. Note
that all data in inline-JSON is gzip-compressed -- even when it's a PNG file.
This doesn't make sense space-wise, but it's always the same accessor to data
(instead of multiple ways of handling different types). For RAW point data, it
usually decreases the data size significantly.
Short answer: It didn't work for me. First, I found it really troublesome to find working documentation and the command line tool is insanely unhelpful (for example, sigrok-cli has a "--driver" option -- but which drivers are available? Same goes for file formats, etc.). Then, the version included in my disto (Ubuntu Artful) were too old to properly recognize my Rigol. Then, I built everything from git and tried to fetch data and save it as CSV. Sigrok dumped something that looked like CSV, but also had some "CH1: 1.23V" lines before it, meaning that I would have needed to manually change the CSV.
Super annoying stuff. In effect, when sigrok would be more user-friendly, it should comlpetely replace this little tool. Until it does, this project will stay here.
rigolrdout only needs Python3 and Gnuplot.
GNU GPL-3.