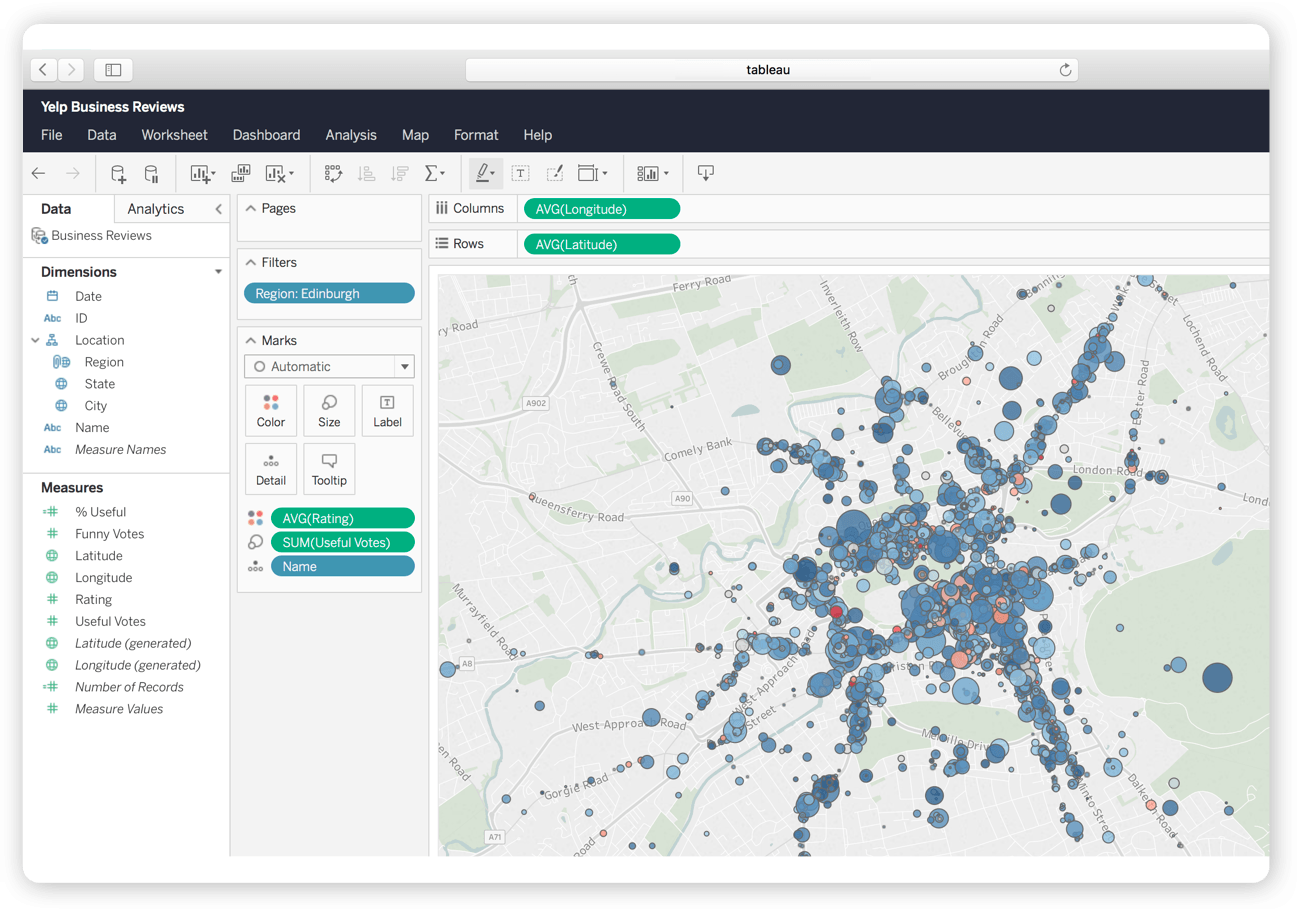
In this course, you will learn how to:
- Clean and transform datasets.
- Systematically extract insights from data.
- Create visualizations to present your work.
Regardless of your major, learning how to analyze data is worthwhile investment. Being data-savvy and able to design production-ready graphics is a wonderful way to leave an impression on your professors, thesis supervisors, and internship mentors. It gets even better: Anyone can become an analyst. The only requirements are a set of technical skills and a theoretical understanding of the challenges you face.
Combining theory and practice, this course will teach you the basics of analyzing data. Each session will be centered around one of the stages of data analysis:
21 Sep - Introduction to Analytics
This session will set the theoretical basis for the session to come. By the end, every student should have an understanding of data concepts (e.g. analytics) and some of the common challenges that organizations face (e.g. lack of data literacy, data quality issues). Additionally, we will introduce Tableau and explain the final assignment.- Gain a conceptual understanding of data and analytics.
- Learn the most common career paths for data professionals.
- Be exposed to some of the common data challenges in organizations.
- Become acquainted with Tableau.
28 Sep - Storing & Extracting Data
Storing and extracting data is generally overlooked. It is not a very sexy topic. But the truth is that data is rarely delivered to you on a golden platter. You need to go and find it. In this session, we will compare different types of datasources (e.g. data lakes, data warehouses, APIs). In the end, students will get to practice extracting data from different data sources using Tableau.- Exposure to the most common data storage ecosystems.
- Learn the most common challenges around ingestion, storage, and extraction of data.
- Practice loading different types of datasources in Tableau.
05 Oct - Cleaning & Transforming Data
Cleaning and transforming data is an essential part of any analysis. During this session we will discuss "tidy data" principles and practice some of the common data cleaning steps (e.g. filters, pivoting, selecting columns) in Tableau.- Learn the principles of tidy data.
- Be familiar with some common data transformations.
- Practice cleaning data and using formulas in Tableau.
12 Oct - Exploring & Analyzing Data
How can you extract information from a dataset? Is it always like looking for a needle in a haystack? In this session, we will explore some techniques and features that allow you to systematically explore a dataset.- Exposure to some techniques to explore data.
- Practice EDA with Tableau.
19 Oct - Visualizing & Presenting Data
Presenting findings is an essential part of the role of an analyst. And what better way than creating graphs to explain your findings. In this course, we will practice the basics of data storytelling and creating appealing visuals.- Explore common visualization types.
- Learn how to format visuals using Tableau.
- Grasp the basics of Data Storytelling.
26 Oct - Presenting Final Assignments
On this session, every student will present their dashboard/infographic to the rest of the class.For your final assignment, you will need to create a dashboard or infographic. Did I mention already there is a prize for the best assignment?
Dataset
For this project, you are allowed to use ANY dataset you want. Get creative. Need inspiration? Here are some ideas:- Make it personal: Websites like Netflix, Facebook, LinkedIn, YouTube, and Google allow you to extract your own data.
- Collect the data yourself: Measure things like your daily commute, the time you spent at the ACLO, how much beer you drank.
- Use public data: Pages like MakeOverMonday or Maven Analytics contain hundreds of datasets suitable for visualizing.
Guidelines
To determine who is the best, each assignment will be rated in these categories (in alphabetical order):- Aesthetics: Does it look good? Is the design pleasant to the eye?
- Complexity: Did you try using advanced features?
- Creativity: Is your work truly unique?
- Maintanability: Is it clean and well-documented?
- Robustness: Will this still work in some months from now?


