Use Case: Leak Checking
How does one go about finding a memory leak in a production application? For that matter, what if there is no leak, but the application is exhausting memory for non-apparent reasons? Heap profiling can help.
jemalloc's heap profile output files are a functional superset of those created by gperftools, so the gperftools heap profiler documentation is relevant reading. You will need to use the jeprof Perl script that comes with jemalloc rather than the pprof Perl script that is part of the gperftools distribution, because jemalloc uses an incompatible file format to output per thread heap profile data, whereas pprof only understands global heap profile data.
Let's start off with the simple case, where it is possible to shut the application down and see what memory was still allocated at exit. The offending application we will look at is w:
MALLOC_CONF=prof_leak:true,lg_prof_sample:0,prof_final:true \
LD_PRELOAD=${JEMALLOC_PATH}/lib/libjemalloc.so.2 w
This will result in something like the following output when the program exits:
<jemalloc>: Leak summary: 267184 bytes, 473 objects, 20 contexts
<jemalloc>: Run jeprof on "jeprof.19678.0.f.heap" for leak detail
To learn more about the leaks, run:
jeprof --show_bytes `which w` jeprof.19678.0.f.heap
    Using local file /usr/bin/w.
Using local file jeprof.19678.0.f.heap.
Welcome to jeprof!  For help, type 'help'.
(jeprof) top
Total: 267184 B
  258032  96.6%  96.6%   258032  96.6% _3_2_5
    3616   1.4%  97.9%     3616   1.4% _nl_intern_locale_data
    2048   0.8%  98.7%     2208   0.8% __tzfile_read
    1024   0.4%  99.1%     1024   0.4% getpwnam
    1024   0.4%  99.5%     1072   0.4% getpwuid
     448   0.2%  99.6%      448   0.2% __gconv_lookup_cache
     384   0.1%  99.8%      384   0.1% getutent
     224   0.1%  99.9%      224   0.1% strdup
     160   0.1%  99.9%      160   0.1% __tzstring
     128   0.0% 100.0%     3760   1.4% _nl_load_locale_from_archive
      48   0.0% 100.0%       48   0.0% get_mapping
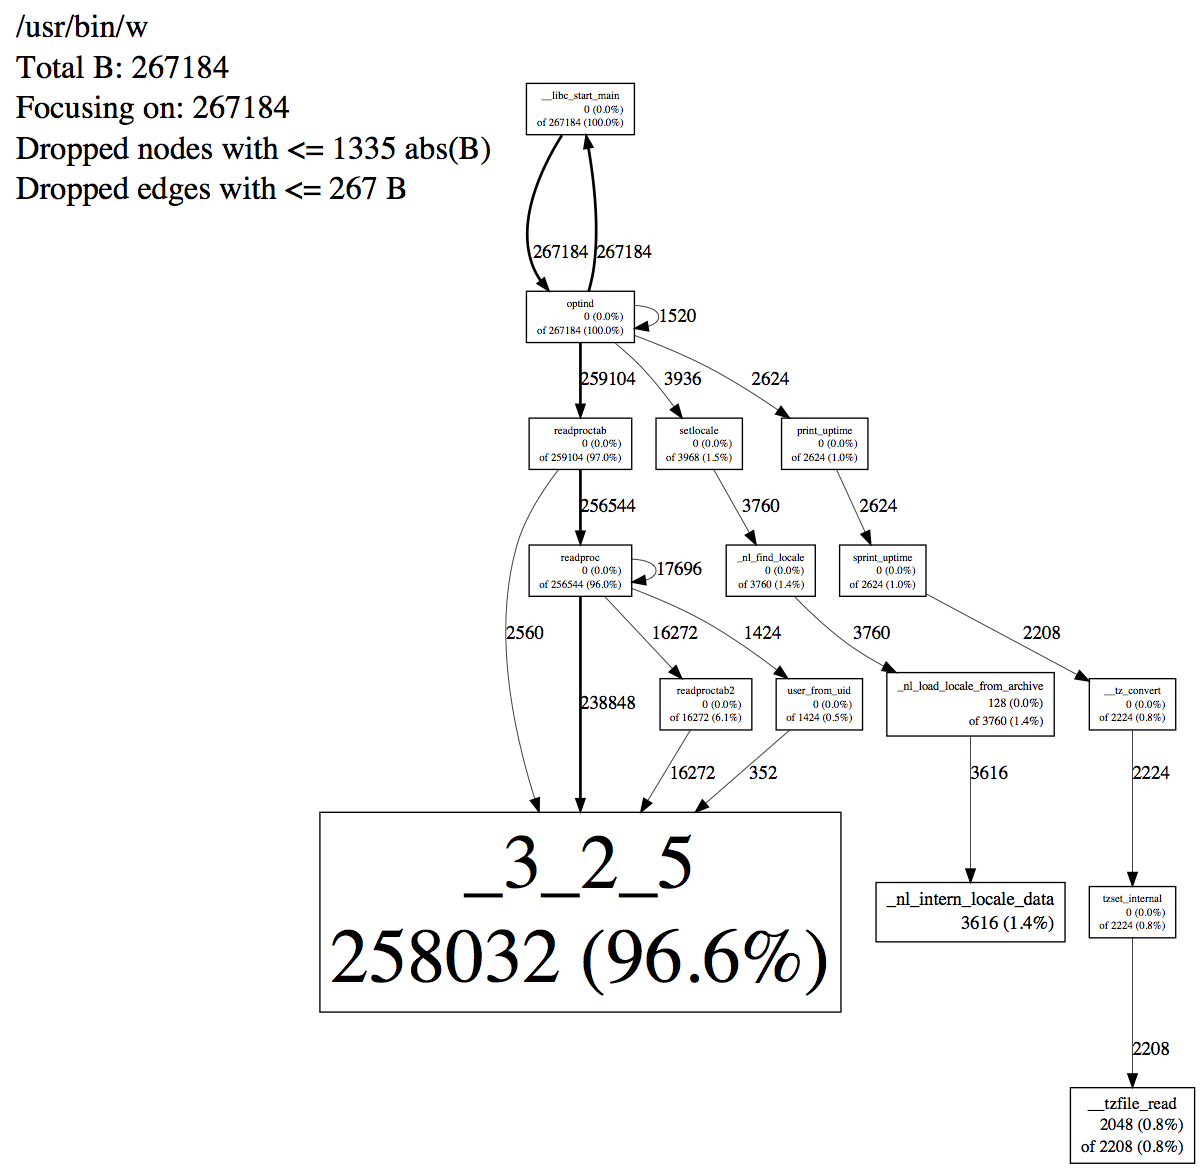
To generate a PDF of the call graph for where the leaks occurred, run:
jeprof --show_bytes --pdf `which w` jeprof.19678.0.f.heap > w.pdfHere is the result: