This is actually a follow-up to "Mapping-Sysmonlogs-to-ATTACK". After you obtain the syslog.csv through program in that repository, you can further convert those logs into a graph structure with relations through this program
- I've uploaded my dataset as
syslog.rar, you could directly use it for an experiment, don't worry - I also uploaded the output files based on my dataset in the
Outputsdirectory
Python3: generate "collection" files for the graph
ArangoDB: a graph database for visualizing the log graph
1. Put the syslog.csv in the same directory with the syslog_correlation.py (or change the file path in source code)
2. Execute the syslog_correlation.py. This program will automatically correlate your logs and output several files as components of a graph
3. Import the outputs into ArangoDB and create the visualized graph. For detailed instructions, please refer to here
1. process.csv: A higher level that we extract from the logs, which includes all processes happened in the period
2. SyslogSyslog.csv: Relation within sysmon logs that extracted from the ProcessGuid field
3. SyslogProcess.csv: Relation between sysmon logs and processes according to their ProcessGuid field
4. ProcessProcess.csv: Relation within processes according to the SourceProcessGUID and TargetProcessGUID fields of logs whose EventID = 10
5. ParentpChildp.csv: Relation within processes according to the ParentProcessGuid field of logs whose EventID = 1

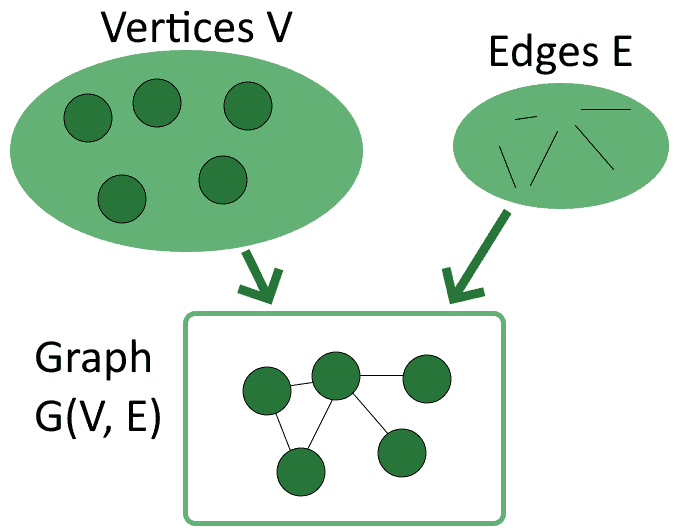
1. To construct a graph, there are 2 key elements: vertice and edge. There is no doubt that each log can play the role as vertice in the graph, and its fields become attributes of the vertice. However, what can be used as the edge? Through our investigation, we have found and testified 5 kinds of relations hide in the logs, and proposed a complete structuring process
2. Generally, the only relation that we can intuitively perceive from logs is their "time" attribute. To be more specific, all logs were generated and recorded chronologically. In other words, there is already a "line" that strings the logs together

3. Inspired by the SysmonTools, we got to known that there is a field called ProcessGuid that could help gather logs which belong to the same process together

4. For better understanding, we specifically created a file to store the "process". Since each process has a unique ProcessGuid, we first obtain all ProcessGuid from syslog.csv and drop the duplicated ones, then number them start from 1 and write them into another csv file. By doing so, the connection between "syslog" and "process" is simplified as well. We only need to connect the first log to the corresponding process instead of connecting all logs to their process
5. At first, we thought the Time and ProcessGuid are already enough for us to correlate all logs together. Nevertheless, the situation was more complex than we thought. After browsing our dataset, we found that not all logs have such field. Does that mean there are plenty of logs that do not belong to any process? Yes, but do not think that you can simply put them aside as dissociative ones
1. Let me give a quick summary of the above:
- The achievement is now we've found 2 relations
- The problems are:
- 1: the
ProcessGuidfield actually has a low coverage which results in lots of logs remain uncorrelated - 2: the 2 relation we have are all limited within individual process. To be specific, we can correlate logs into a group named "process", and they could be arranged chronologically within the group as well. However, what about the relation between processes?
- 1: the
2. In effect, through our subsequent research, we found that the above 2 questions are actually the answer to each other. We found out that those uncorrelated logs have one thing in common, that is, their EventID fields all have the value as "10". In other words, logs with EventID 10 represent the "ProcessAccess" event in the Sysmon, they are generated because a process is accessing another one. Furthermore, we found those logs indeed have the SourceProcessGUID and TargetProcessGUID fields, which exactly represent the relation between processes!

3. In addition, we also noticed that there is another field called ParentProcessGuid (similar with SourceProcessGUID and TargetProcessGUID, this field only occurs in logs whose EventID=1), which could represent the relation as parent-child between processes. However, are relations embodied by this newly found field already covered by the previous relations? After our comparison, the relations generated by 2 means have only minimal overlap, which means "ProcessCreate" and "ProcessAccess" are dispensable relations within processes

1. For now, we've dug out 2 relations within logs, 1 relation between logs and processes, and 2 relation within processes. Maybe there are some relations still unknown, let's find out in the future
2. The ParentProcessGuid field of Linux systems (Ubuntu18) seems have no relation with its ProcessGuid field at all (We could not find any "parent"). As a result, we think we do not correlate Linux Sysmonlogs properly. Maybe the SysmonForLinux needs further development